
The direction is clear; the meaning needs context
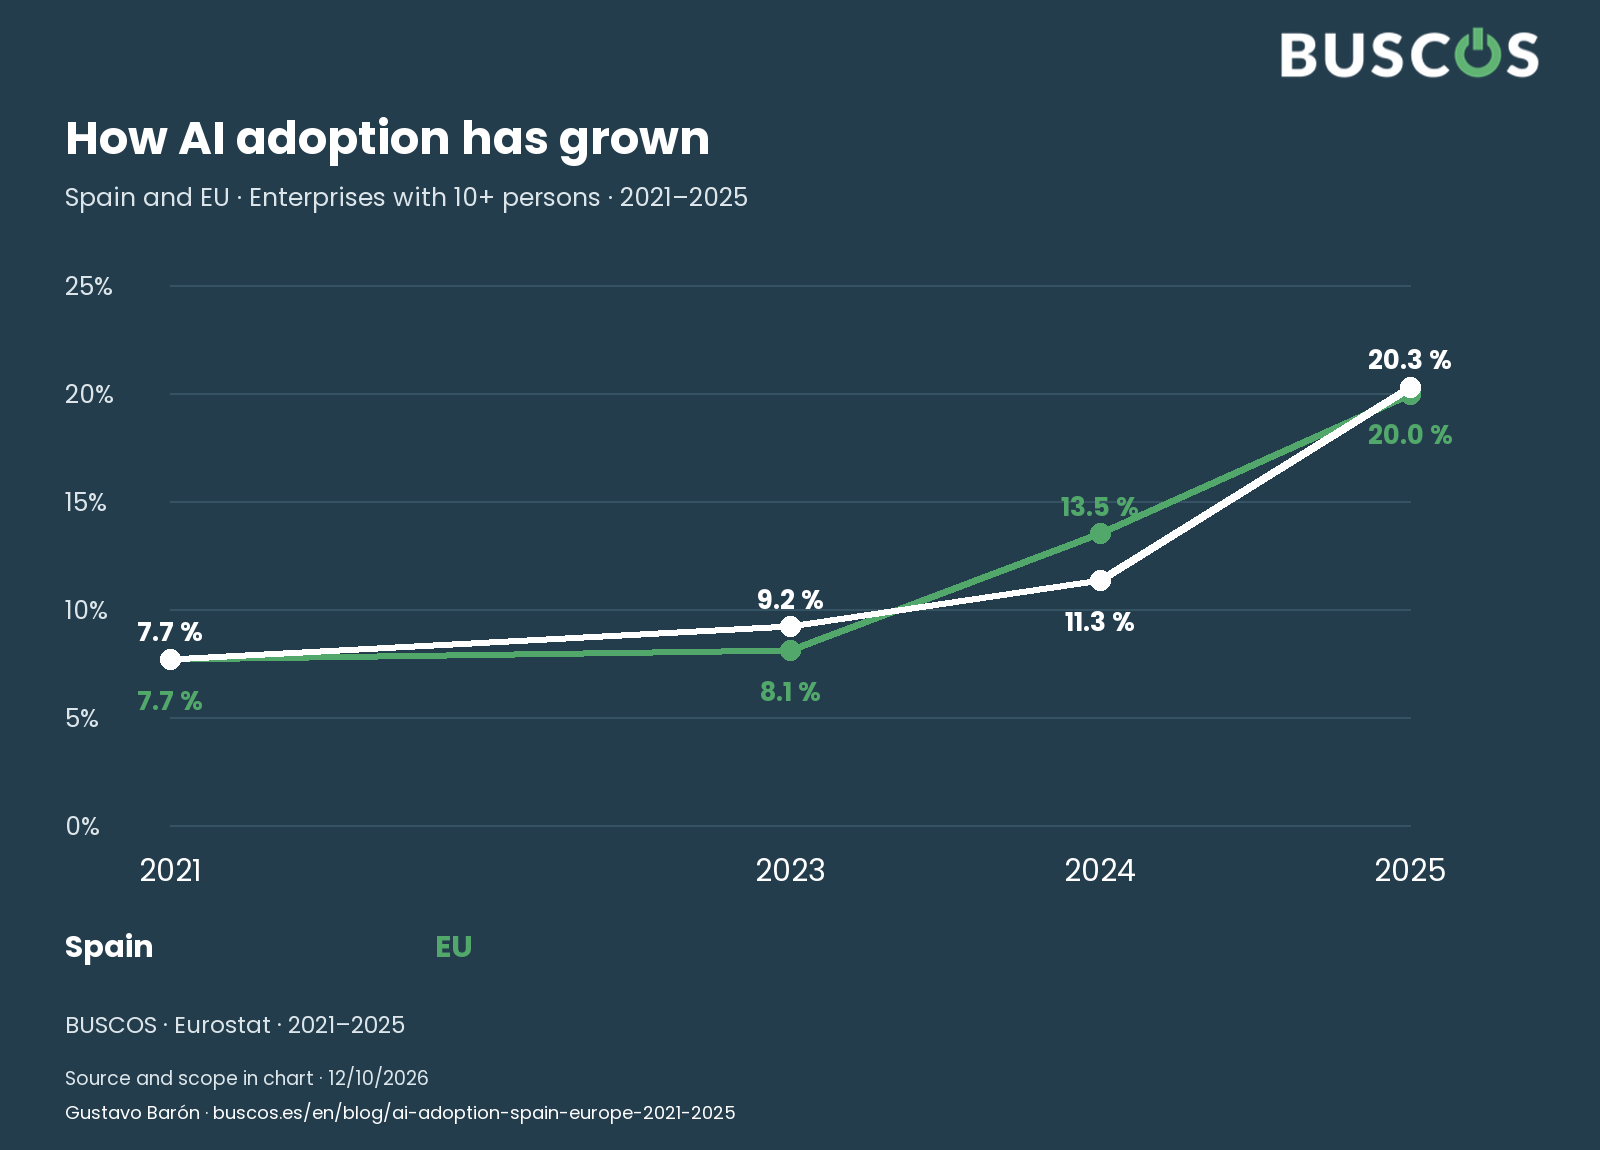
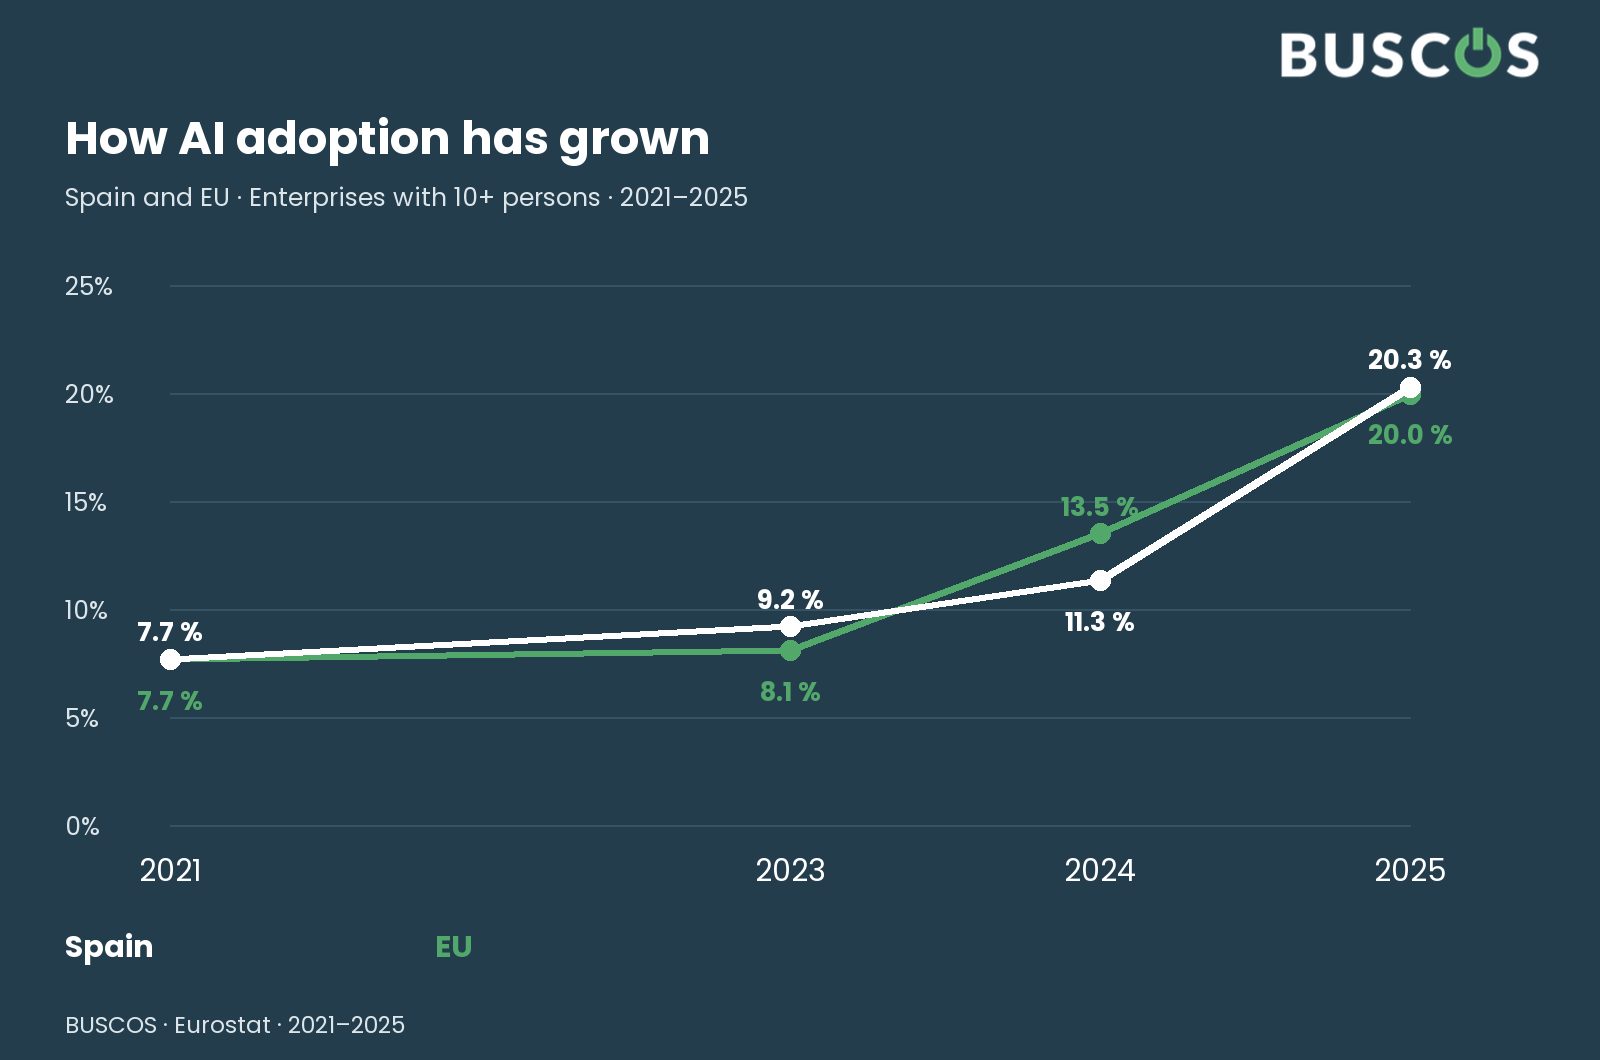
In 2021, 7.67% of Spanish enterprises within Eurostat's scope reported using an AI technology. By 2025 the proportion reaches 20.27%. The EU benchmark moves from 7.65% to 19.95%. The series clearly shows wider use, although it does not describe how much work uses these technologies or what results they produce.
The scope covers enterprises with ten or more persons employed in the included sectors. It does not measure every small business or the population's personal use of tools. Each percentage describes the proportion of AI-using enterprises in that period, not an assessment of employees' skills.
The useful reading retains both points: use is much more widespread than at the series' start, and an adoption statistic still cannot establish whether a specific solution works well. Growth helps explain the context in which a business decides. Its decision needs information about the work it wants to improve.
There are four observed periods, not a figure for every year
The query contains 2021, 2023, 2024 and 2025. It provides no 2022 value for this indicator. The table retains the four published periods; the gap is not filled with an average or an estimate. That missing year matters when interpreting the pace of change.
Two years separate 2021 and 2023. One year separates 2023 and 2024, and 2024 and 2025. The changes chart therefore labels each interval and does not call every bar annual growth. These are observed differences between the available endpoints, without annualisation.
A line between observations helps follow the series, but supplies no intermediate measurements. These data do not tell us which month a change occurred or whether use grew steadily. Showing that limitation is preferable to drawing continuity that appears more detailed than the evidence.
Spain and the EU do not maintain a constant distance
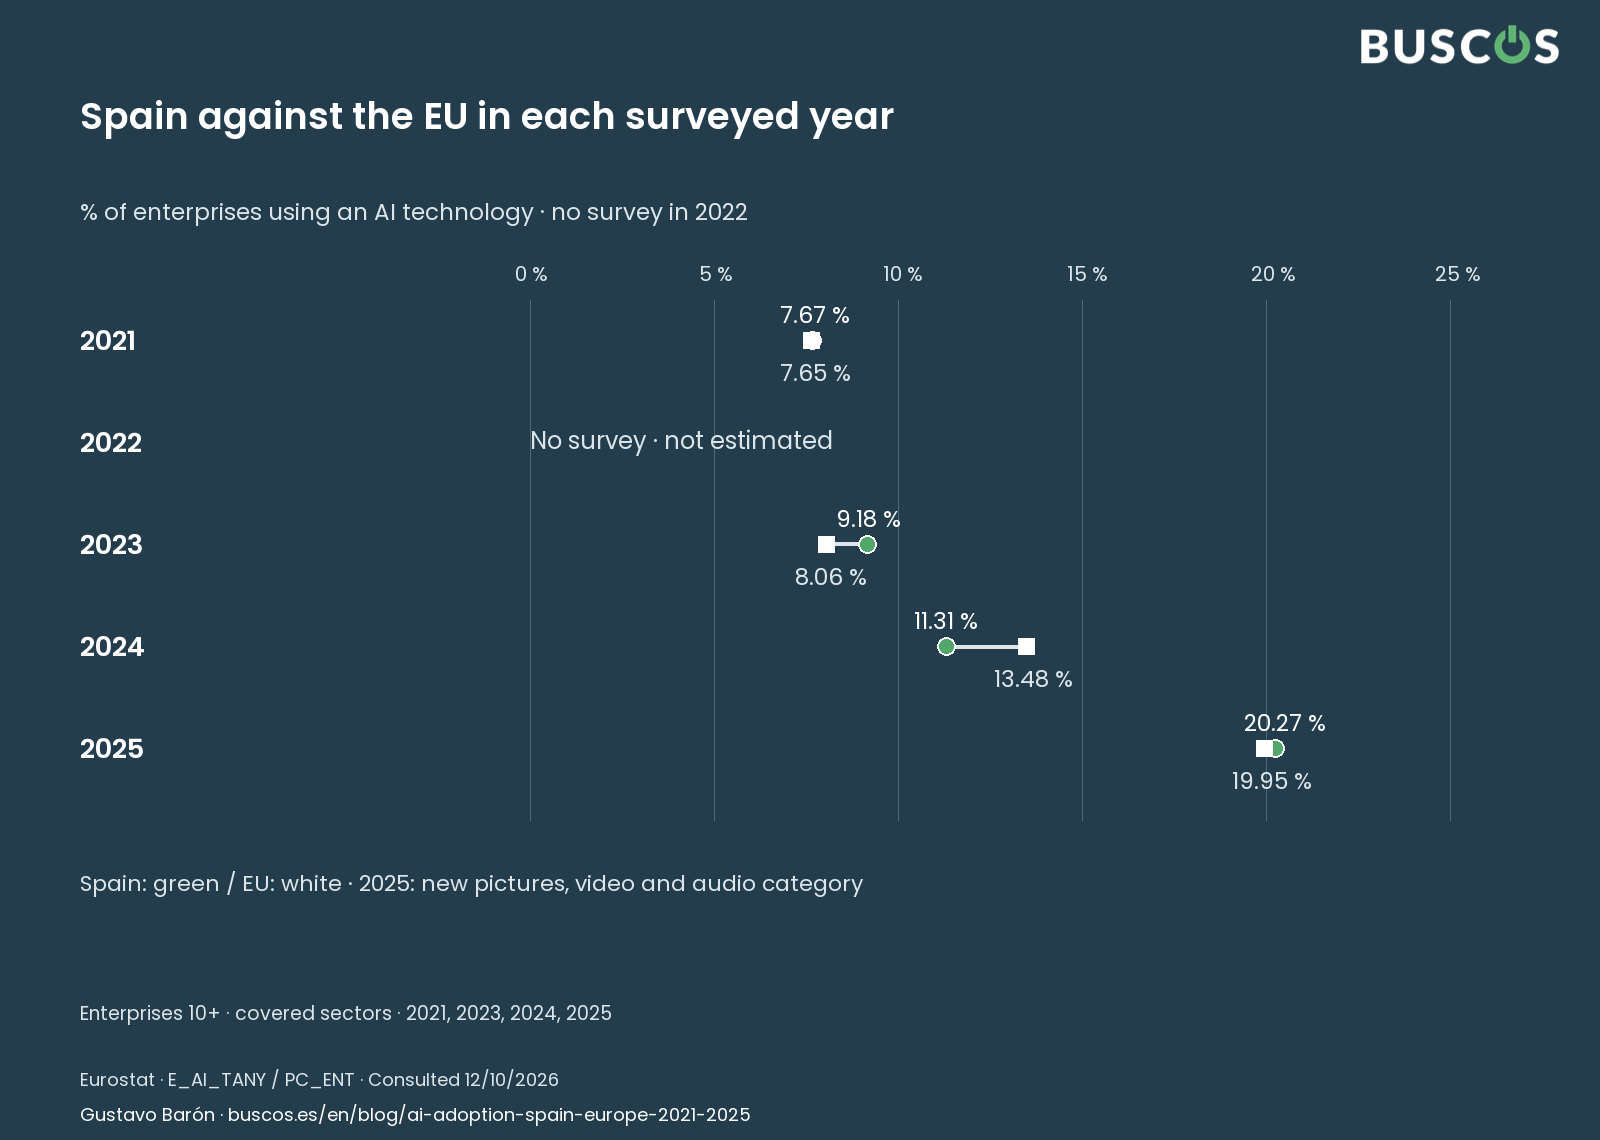
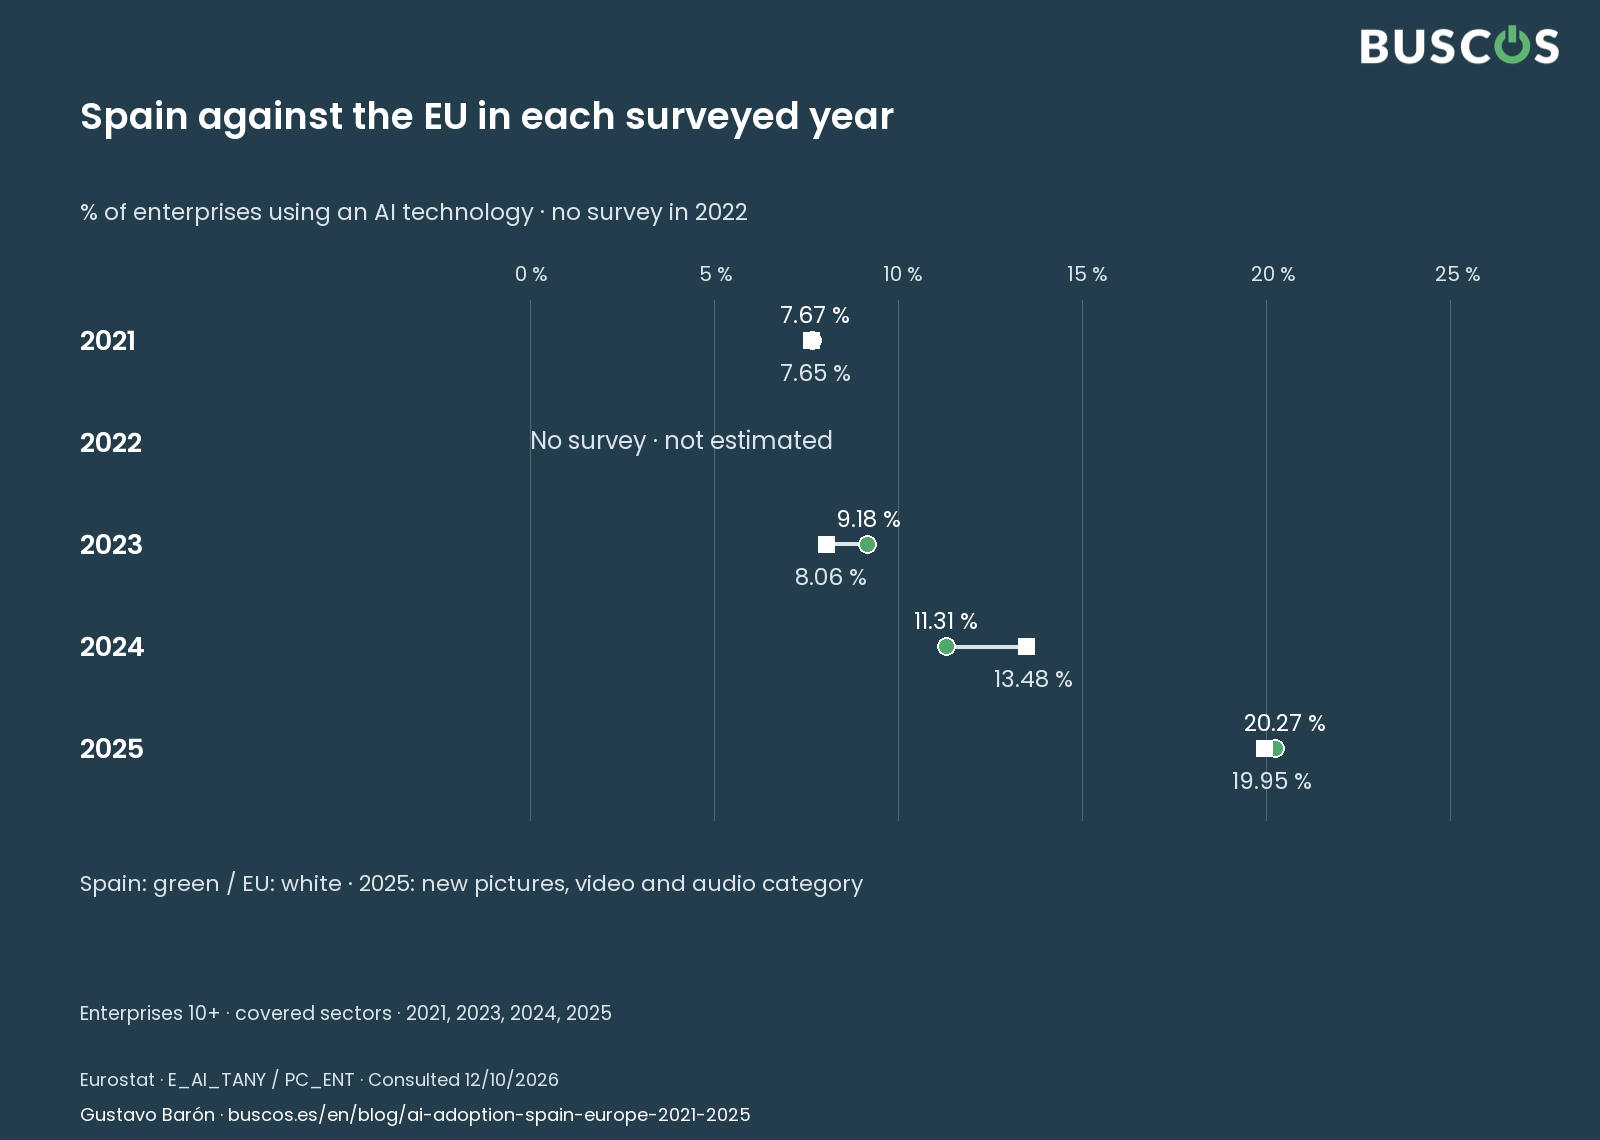
Spain and the EU benchmark are almost level in 2021. In 2023, Spain records 9.18% against the EU's 8.06%. The relationship changes in 2024: Spain reaches 11.31% and the EU 13.48%. In 2025 the figures are close again, with Spain slightly higher.
The paired chart makes each comparison visible without turning four moments into a permanent competition. Being above in one year and below in another does not demonstrate a change in quality or better financial results. It describes the share of enterprises reporting use in each scope.
The European benchmark is an aggregate, not a country whose business structure can be equated directly with Spain's. The comparison usefully places the proportion in context while preserving the indicator's coverage. Attributing every difference to a policy, tool or business type is unnecessary for the data to matter.
| Year | Spain | EU-27 |
|---|---|---|
| 2021 | 7.67 % | 7.65 % |
| 2023 | 9.18 % | 8.06 % |
| 2024 | 11.31 % | 13.48 % |
| 2025 | 20.27 % | 19.95 % |
Enterprises 10+ in covered sectors. No survey in 2022. A pictures, video and audio generation category is added in 2025.
The latest change is larger, but the questionnaire changed too
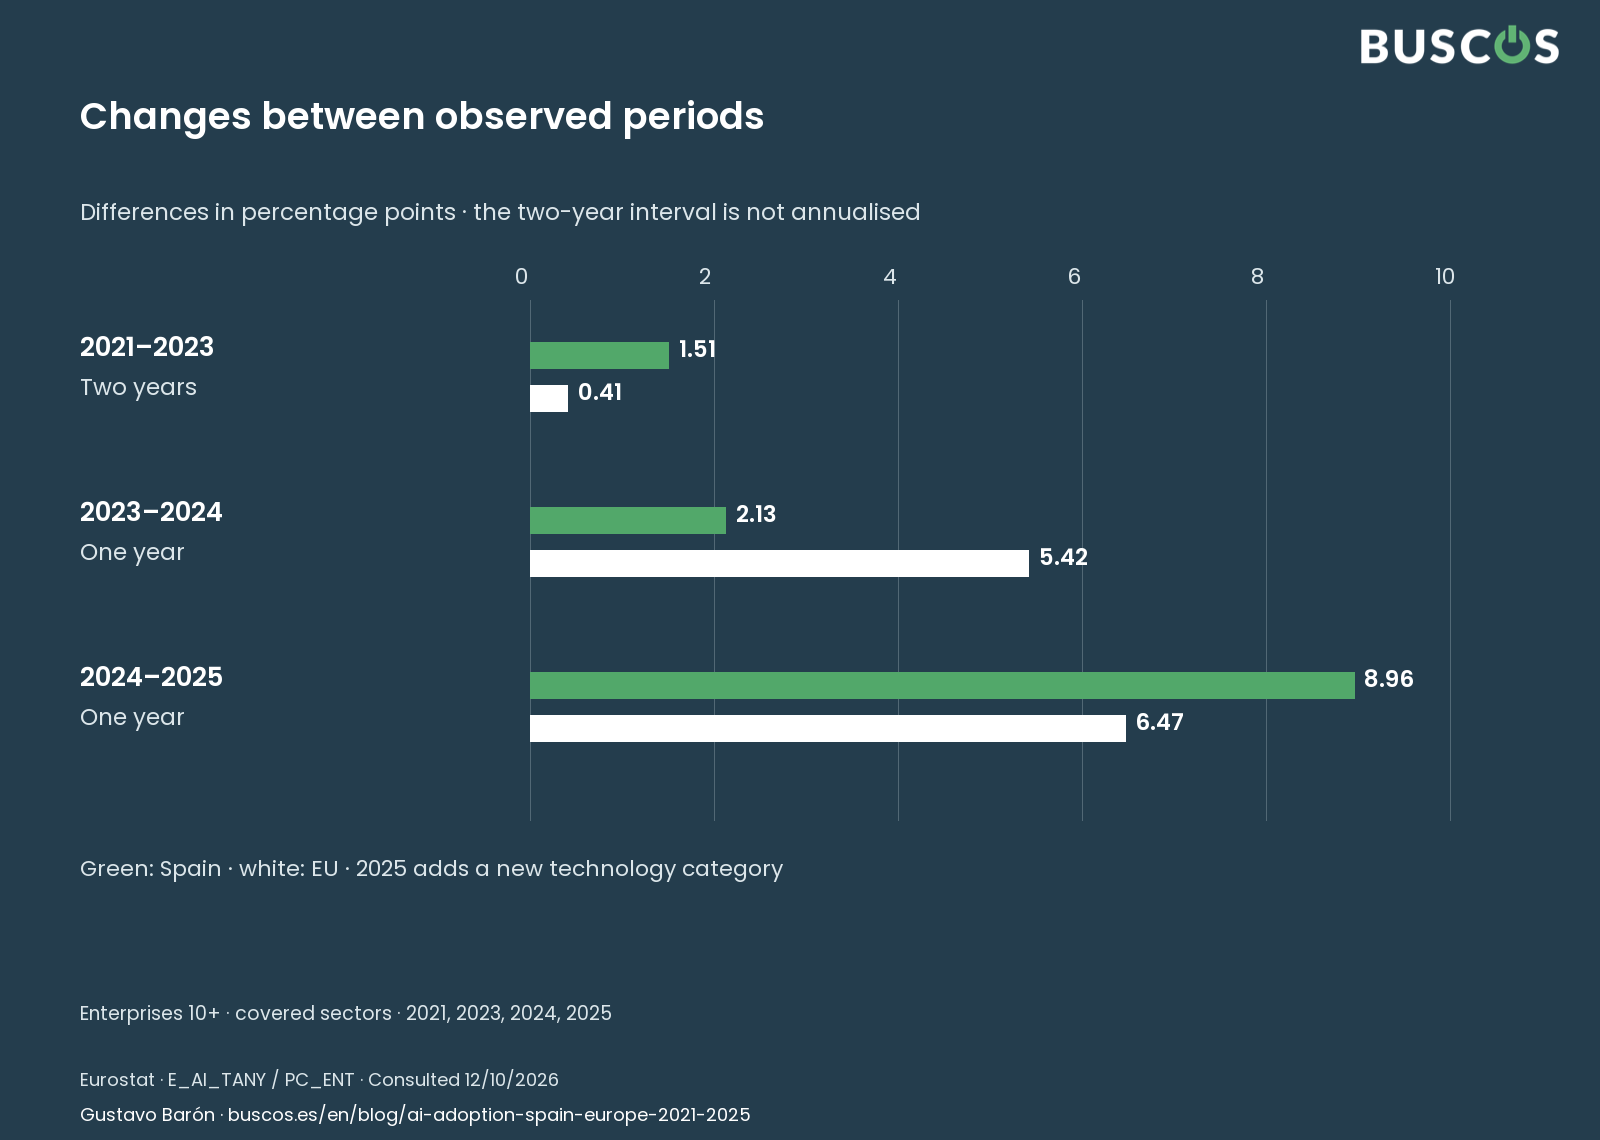
Between 2024 and 2025, Spain increases by 8.96 percentage points and the EU by 6.47. These differences exceed those in the previous interval. The chart and table calculate changes from published values, using two decimal places so the subtraction can be checked.
The 2025 questionnaire added a category for generating images, video and audio with AI. That expansion must accompany the reading of the latest change. These data provide no decomposition separating new uses, different coverage of technologies and other possible contributors to the increase.
The chart therefore does not prove that the market grew at the same rate as a single technology. Nor can the change be projected into the next year. Acknowledging the methodological change preserves the series' value without treating it as a forecast the source does not publish.
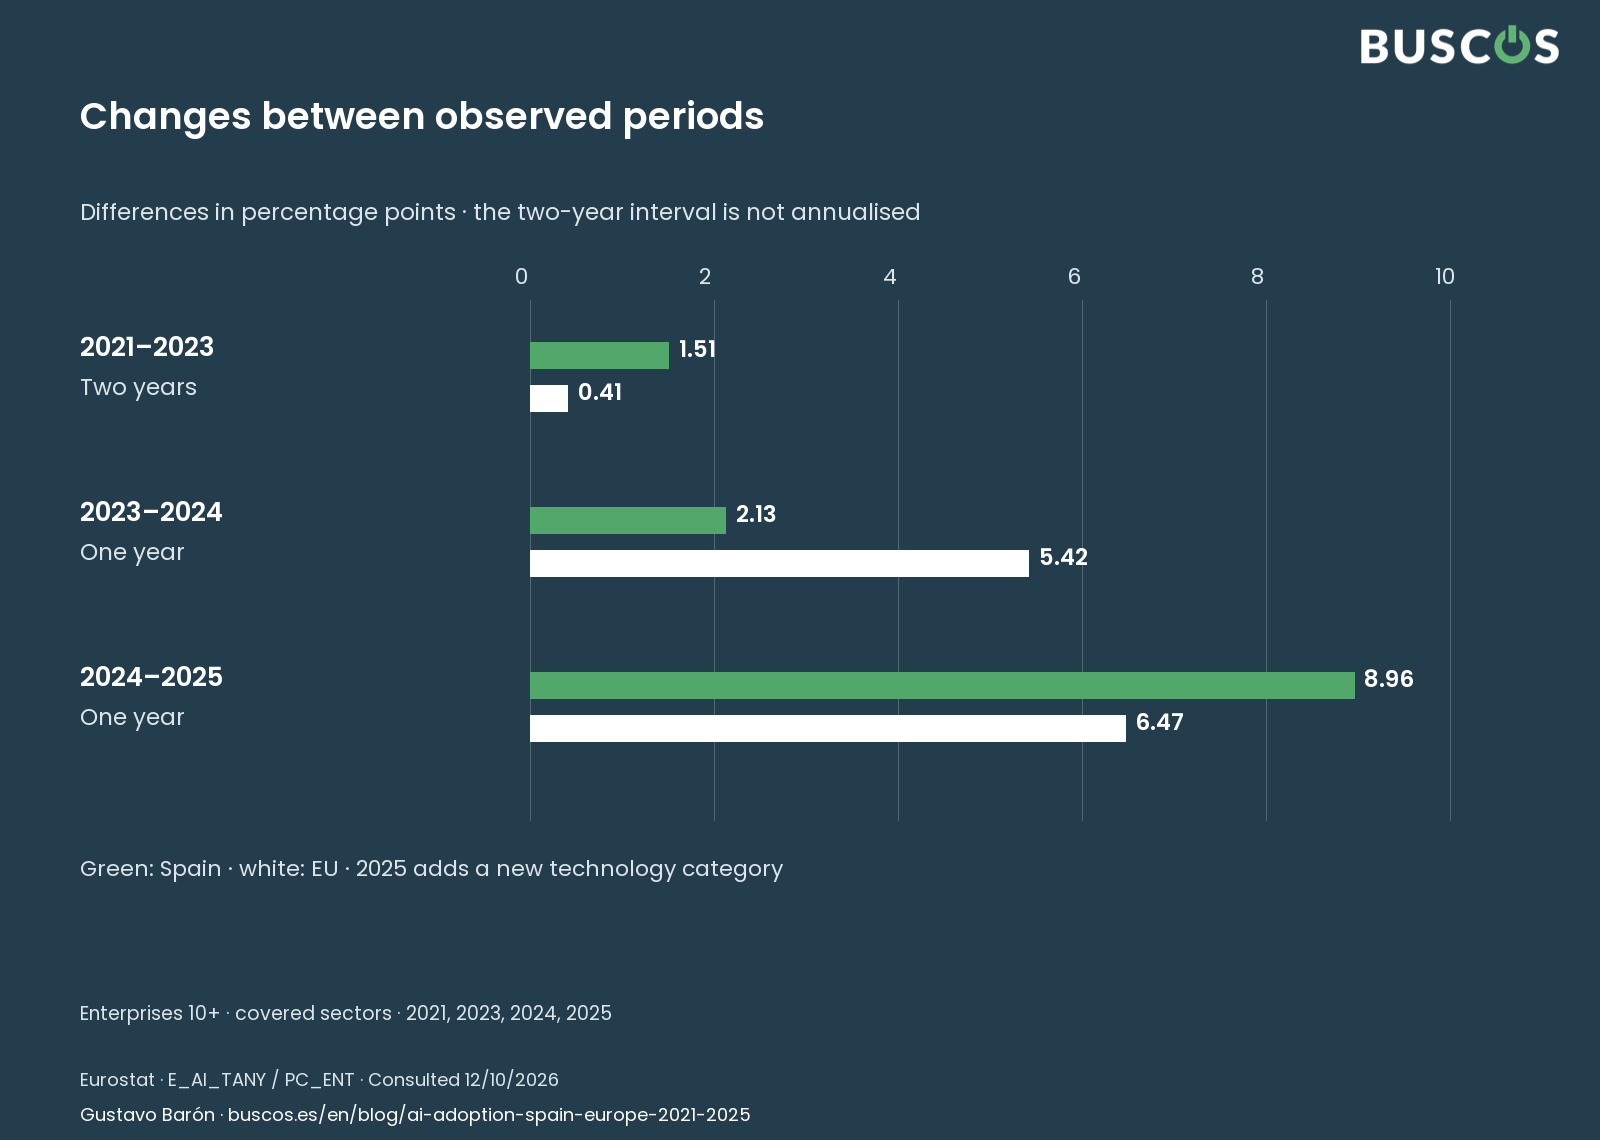
| Interval | Years elapsed | Spain | EU-27 |
|---|---|---|---|
| 2021–2023 | 2 | 1.51 | 0.41 |
| 2023–2024 | 1 | 2.13 | 5.42 |
| 2024–2025 | 1 | 8.96 | 6.47 |
Changes calculated from published values, without annualisation or causal attribution. The questionnaire change accompanies the reading of 2025.
Growth in use does not replace an investment decision
A rising series can make a business feel late. Deciding from that feeling leaves the important questions unanswered: what task should improve, what information does a solution need and who will check the result? Other businesses' adoption does not answer for your own.
Imagine a team seeking to reduce the effort of preparing reports. A proposal may produce them quickly while still requiring lengthy checks of figures and references. Evaluating its usefulness means considering the whole workflow, including corrections, exceptions and responsibilities. This example proposes a check; it does not report an observed saving.
If a quotation already exists, the useful comparison is between its scope and the actual work: what data it needs, who prepares it, what will be tested and what remains outside the assignment. A national growth figure replaces none of that review and does not establish the provider's ability to perform the work.
Four questions for reading a growth chart
When a proposal uses a growth chart as an argument, first ask what unit it counts. AI-using enterprises, individual users and investment are different measures. Next check whether observations refer to the same population and whether the source preserves its definition of use. An appealing title replaces none of these conditions.
The third question concerns the periods actually observed. Two observations two years apart do not describe each intervening year, and a change bar does not necessarily express an annual pace. The fourth concerns the outcome being inferred: a share of enterprises reporting AI does not measure profits, time savings or implementation quality.
These questions make charts useful without dismissing them because of their limits. A well-explained series can provide substantial context. It should not replace the information needed to assess a specific assignment. If a commercial argument jumps directly from growing adoption to promised returns, that step still needs its own supporting evidence.
Read the trend to ask a better question
The series shows AI becoming part of work in a growing proportion of enterprises within this scope. It also shows that Spain and Europe have not always maintained the same distance. The analysis is more useful when its periods, populations and questionnaire change remain visible.
For an individual business, the next question can be modest and specific: what situation would be useful to review now? There may be a repeated task, an unclear proposal or something the team needs to learn. Starting there allows a possible improvement to be examined before it becomes a larger investment.
An average need not decide when the business moves forward. The business needs to explain what it wants to resolve and how the change would be checked. The trend provides context; a well-described need makes it possible to seek help with a recognisable next step.
Sources and how to read the data
Primary sources consulted on 12 October 2026. Practical examples are BUSCOS interpretations, not client results.