
Spain is close to the EU benchmark, well behind Denmark
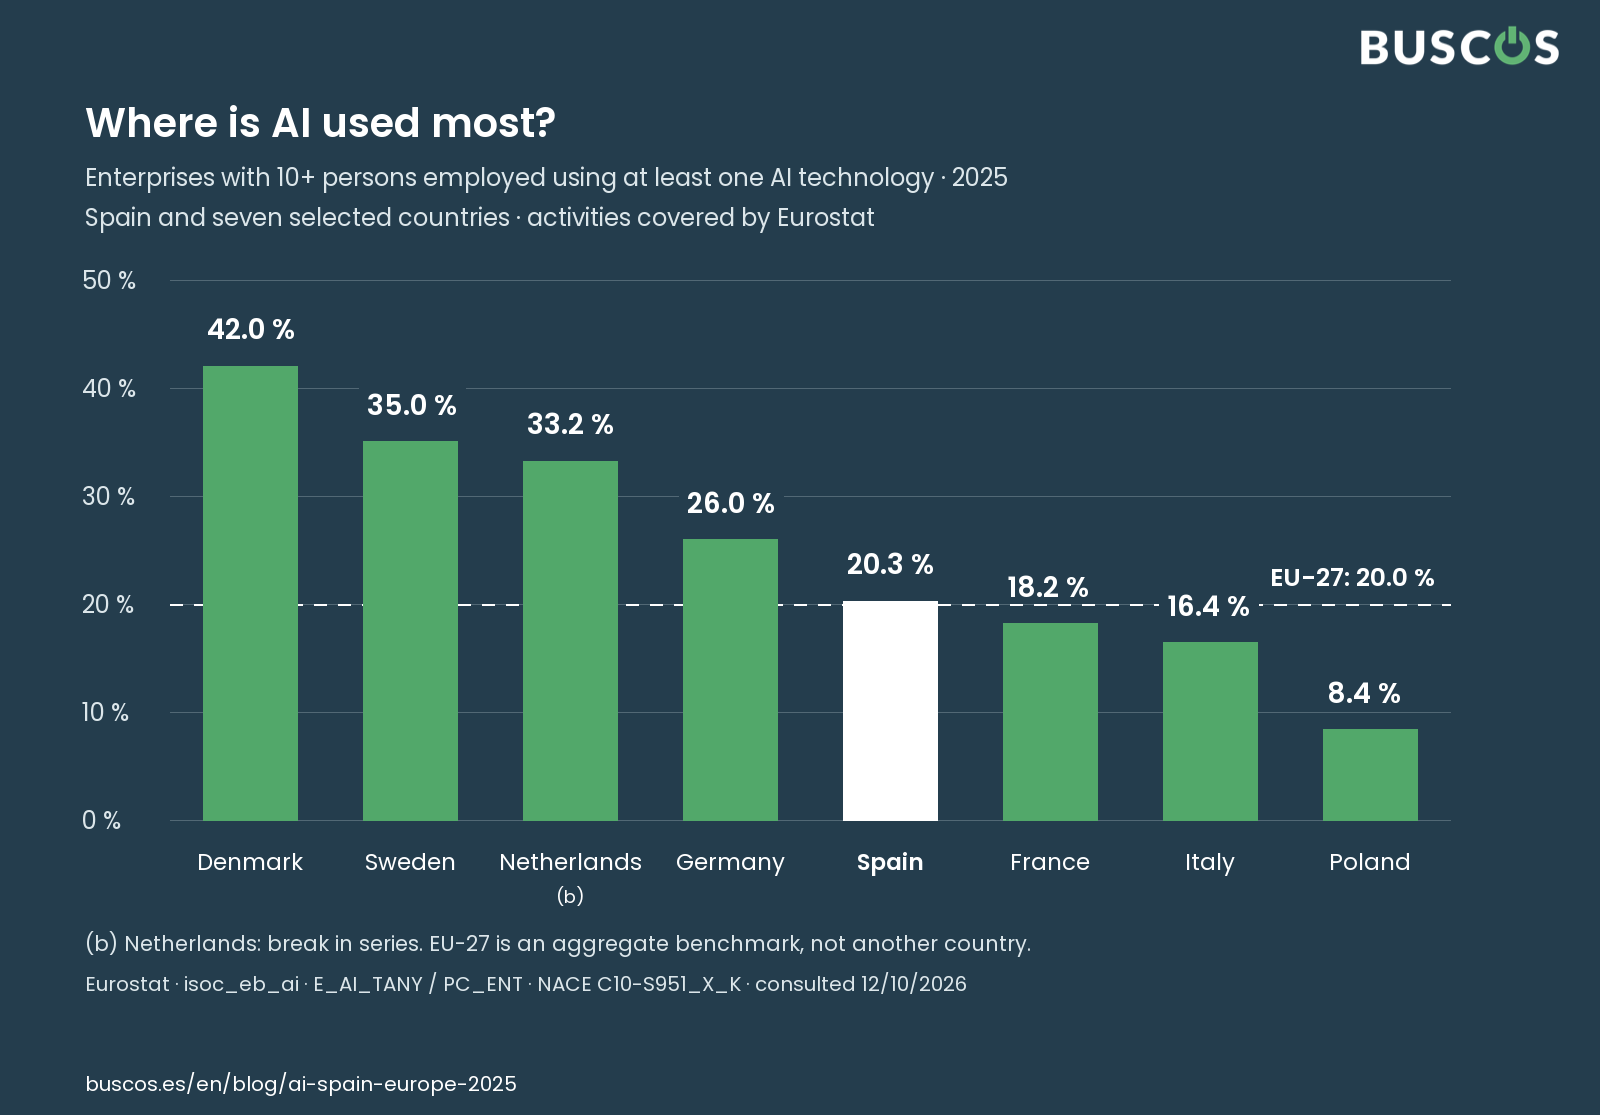
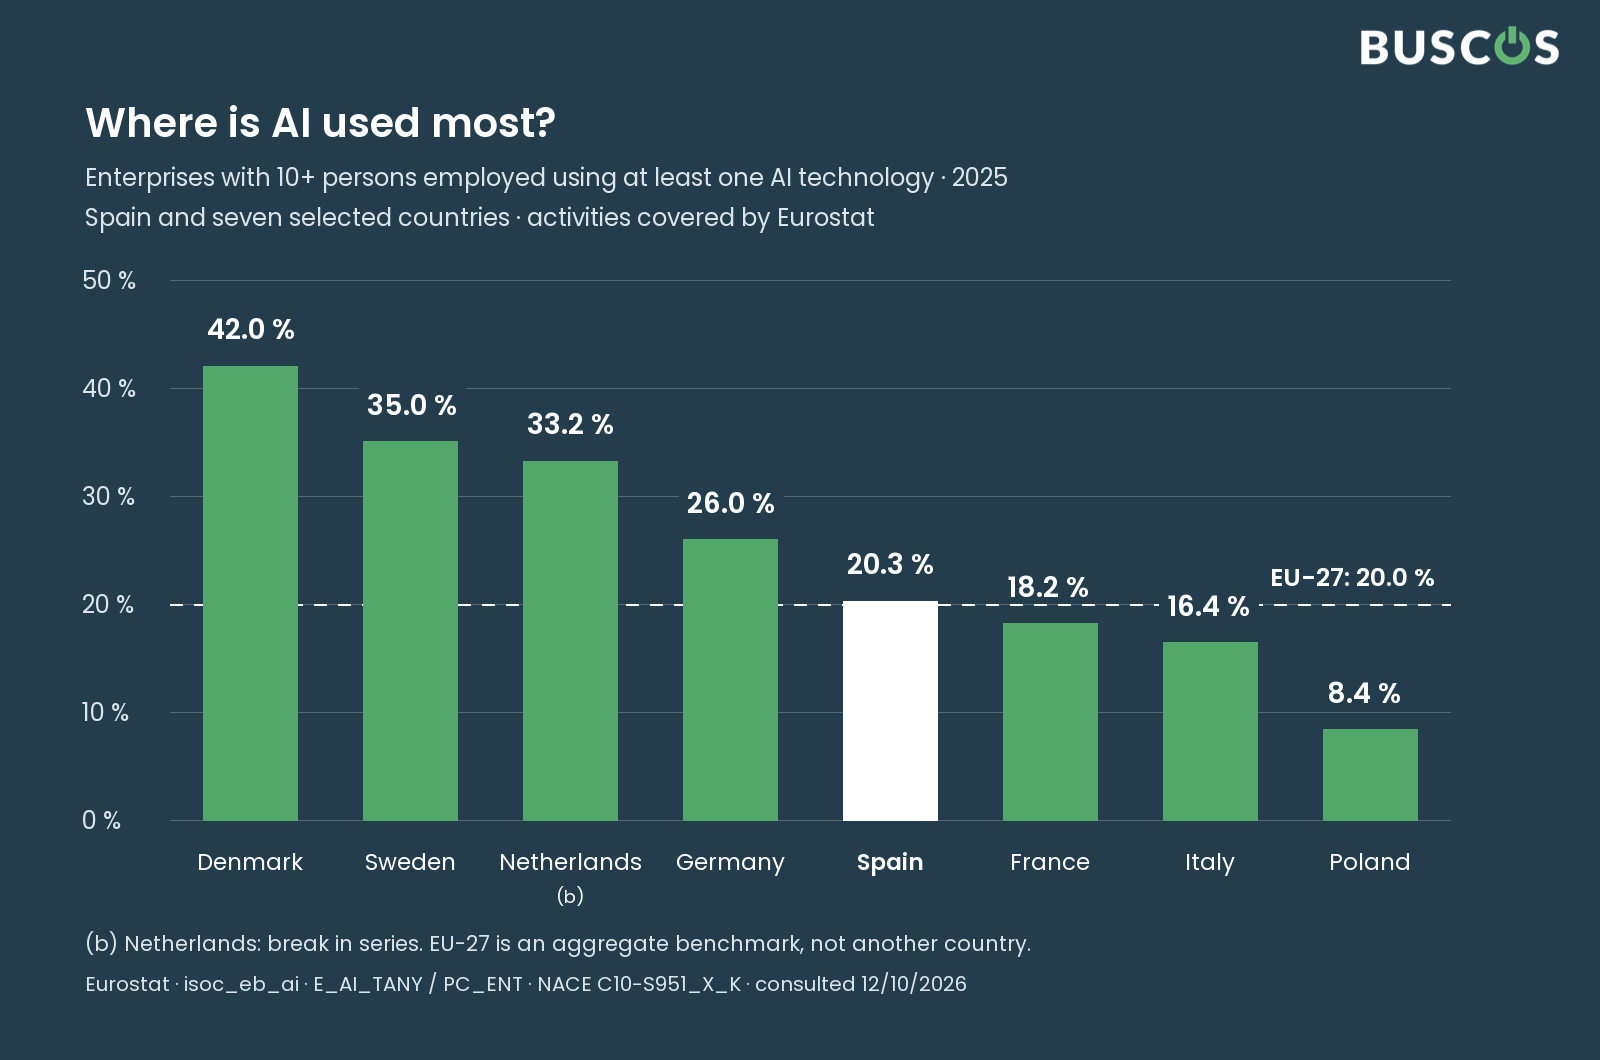
In 2025, 20.3% of Spanish enterprises with ten or more persons employed, in the activities covered by Eurostat, reported using at least one artificial intelligence technology. The European Union benchmark was 20.0%. Spain is almost level with the European aggregate.
The contrast emerges country by country. Denmark reaches 42.0% and Sweden 35.0%. Germany records 26.0%, while France stands at 18.2% and Italy at 16.4%. Spain exceeds the latter two countries, but is almost six percentage points below Germany and almost twenty-two below Denmark.
The proportion of Danish businesses using AI is slightly more than twice Spain's. That is a useful reading of the chart: a technology can be much more widespread in some economies than in others. The next question, however, needs its own data: what reasons do businesses report when they considered using AI but still do not use it?
| Territory | Enterprises in the survey frame | Use AI |
|---|---|---|
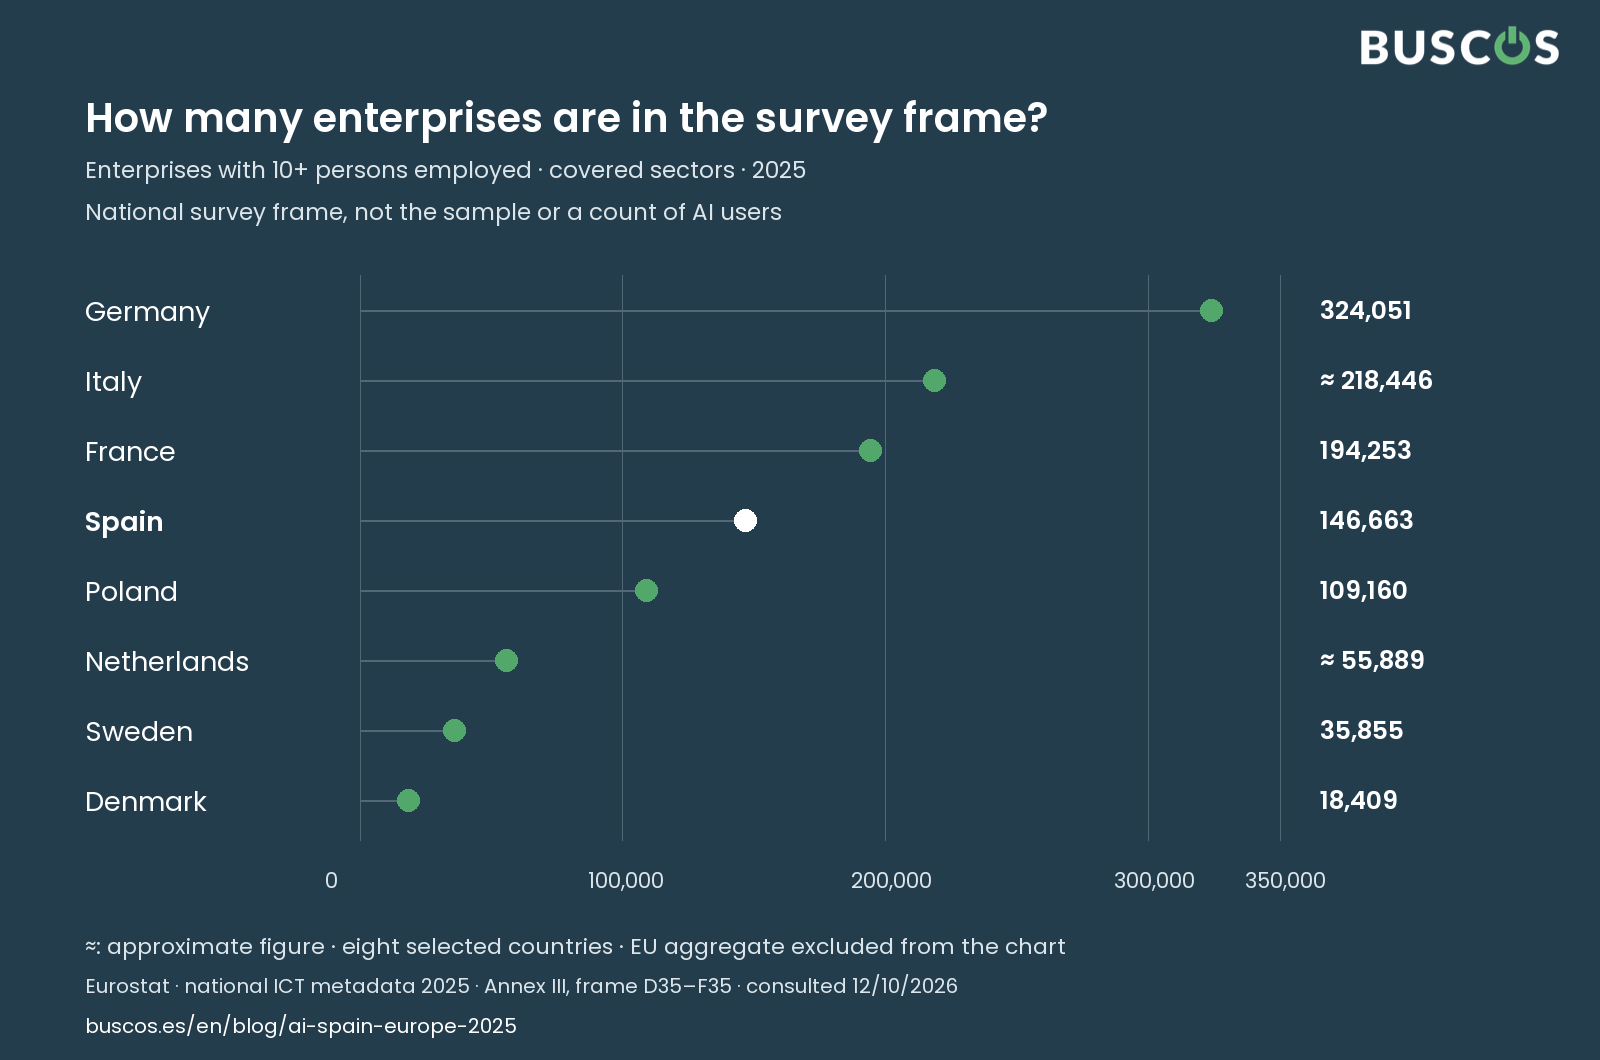
| Spain | 146,663 | 20.3% |
| Denmark | 18,409 | 42.0% |
| Sweden | 35,855 | 35.0% |
| Netherlands | ≈ 55,889 | 33.2% (b) |
| Germany | 324,051 | 26.0% |
| France | 194,253 | 18.2% |
| Italy | ≈ 218,446 | 16.4% |
| Poland | 109,160 | 8.4% |
| EU-27 | ≈ 1.53 million | 20.0% |
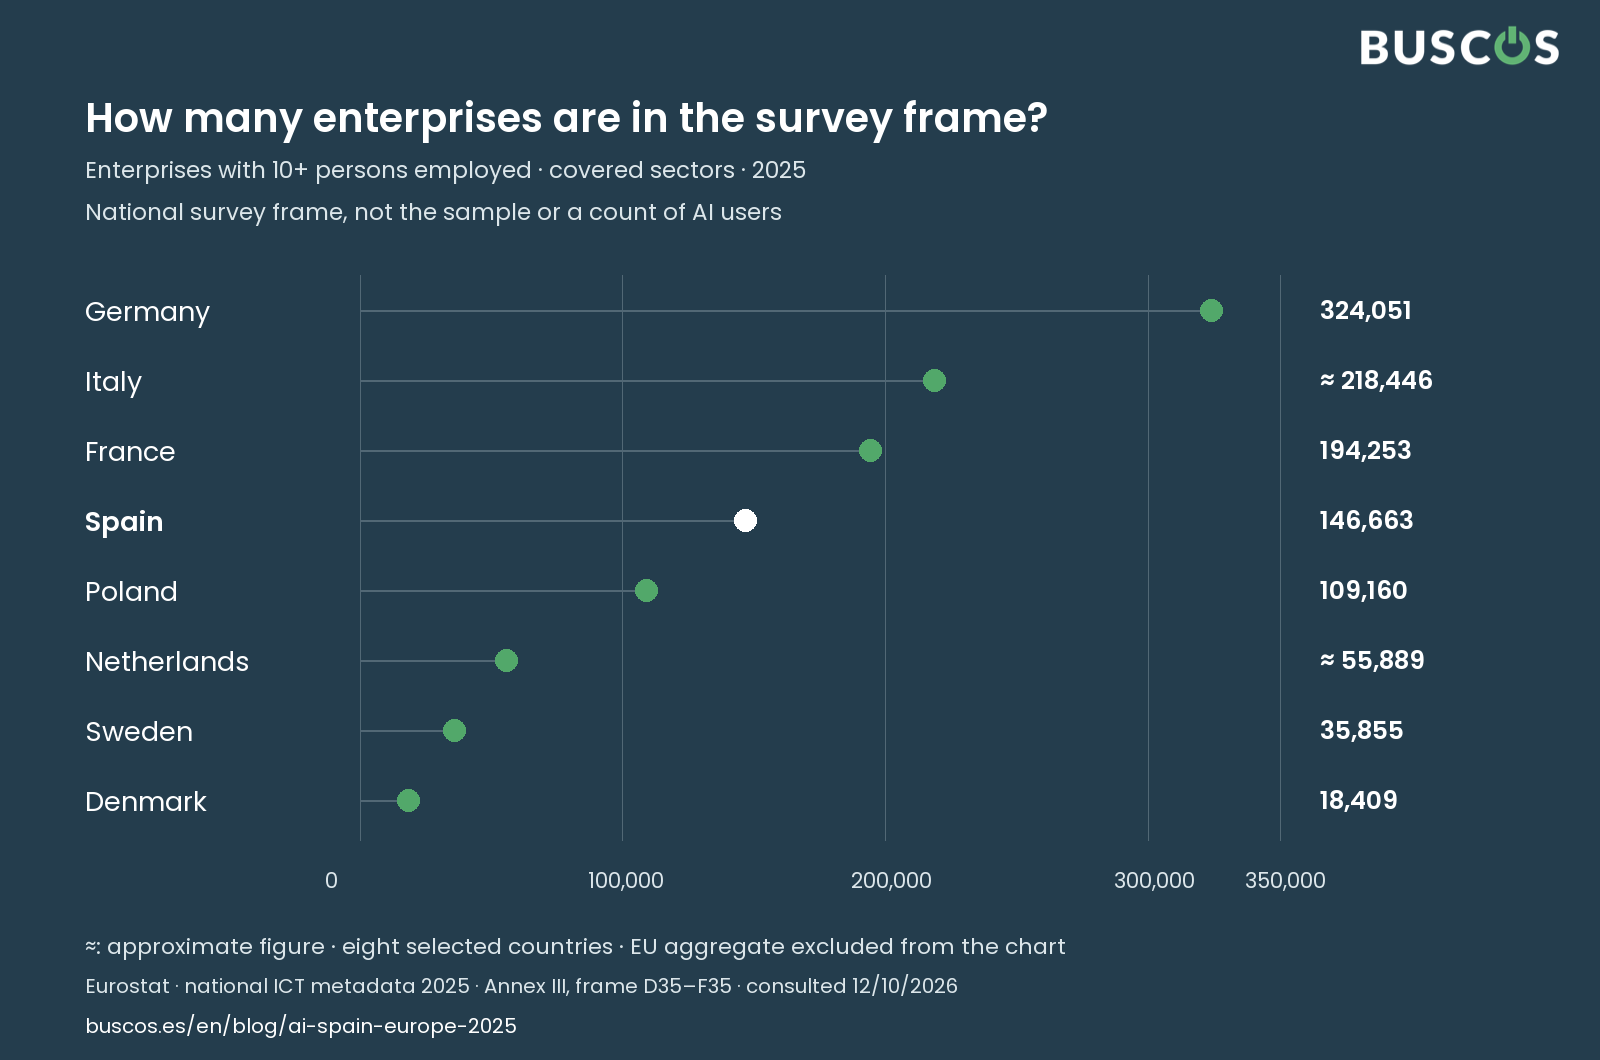
Enterprises with ten or more persons employed in the covered sectors. Counts describe the survey frame, not the responding enterprises or the exact weighted denominator of the percentage. They show the scale of the population studied; they cannot be used to calculate the number of AI users. ≈: approximate figure. (b) Netherlands: break in series. EU-27: European aggregate.
In Spain, 20.3% means that approximately 20 out of every 100 enterprises in that population use AI. It does not measure use among residents or individuals.
Europe contains very different situations
The chart compares Spain with seven European countries and the EU benchmark. Denmark and Sweden show particularly widespread use within this selection. The Netherlands reaches 33.2%; Germany occupies an intermediate position, and Poland, at 8.4%, has the lowest percentage among the countries shown.
This is not a complete ranking of Europe. The selection combines other large EU economies with examples of higher and lower adoption to put Spain in context; it does not give Spain a rank among all member states. Nor can we conclude that businesses in one country achieve better results simply because more of them report using AI.
The indicator counts enterprises using at least one of the technologies covered. This adoption measure does not describe how much work uses those technologies or what results they produce. To understand the differences, we should keep the question of who uses AI separate from another: what difficulties businesses that considered using it encounter.
Spain and Denmark: almost thirty percentage points apart on cost
Eurostat also asks about reasons for not using AI. Here the population changes: the following percentages refer to enterprises that considered using these technologies but do not use them. These are reported reasons, and respondents can select several at once.
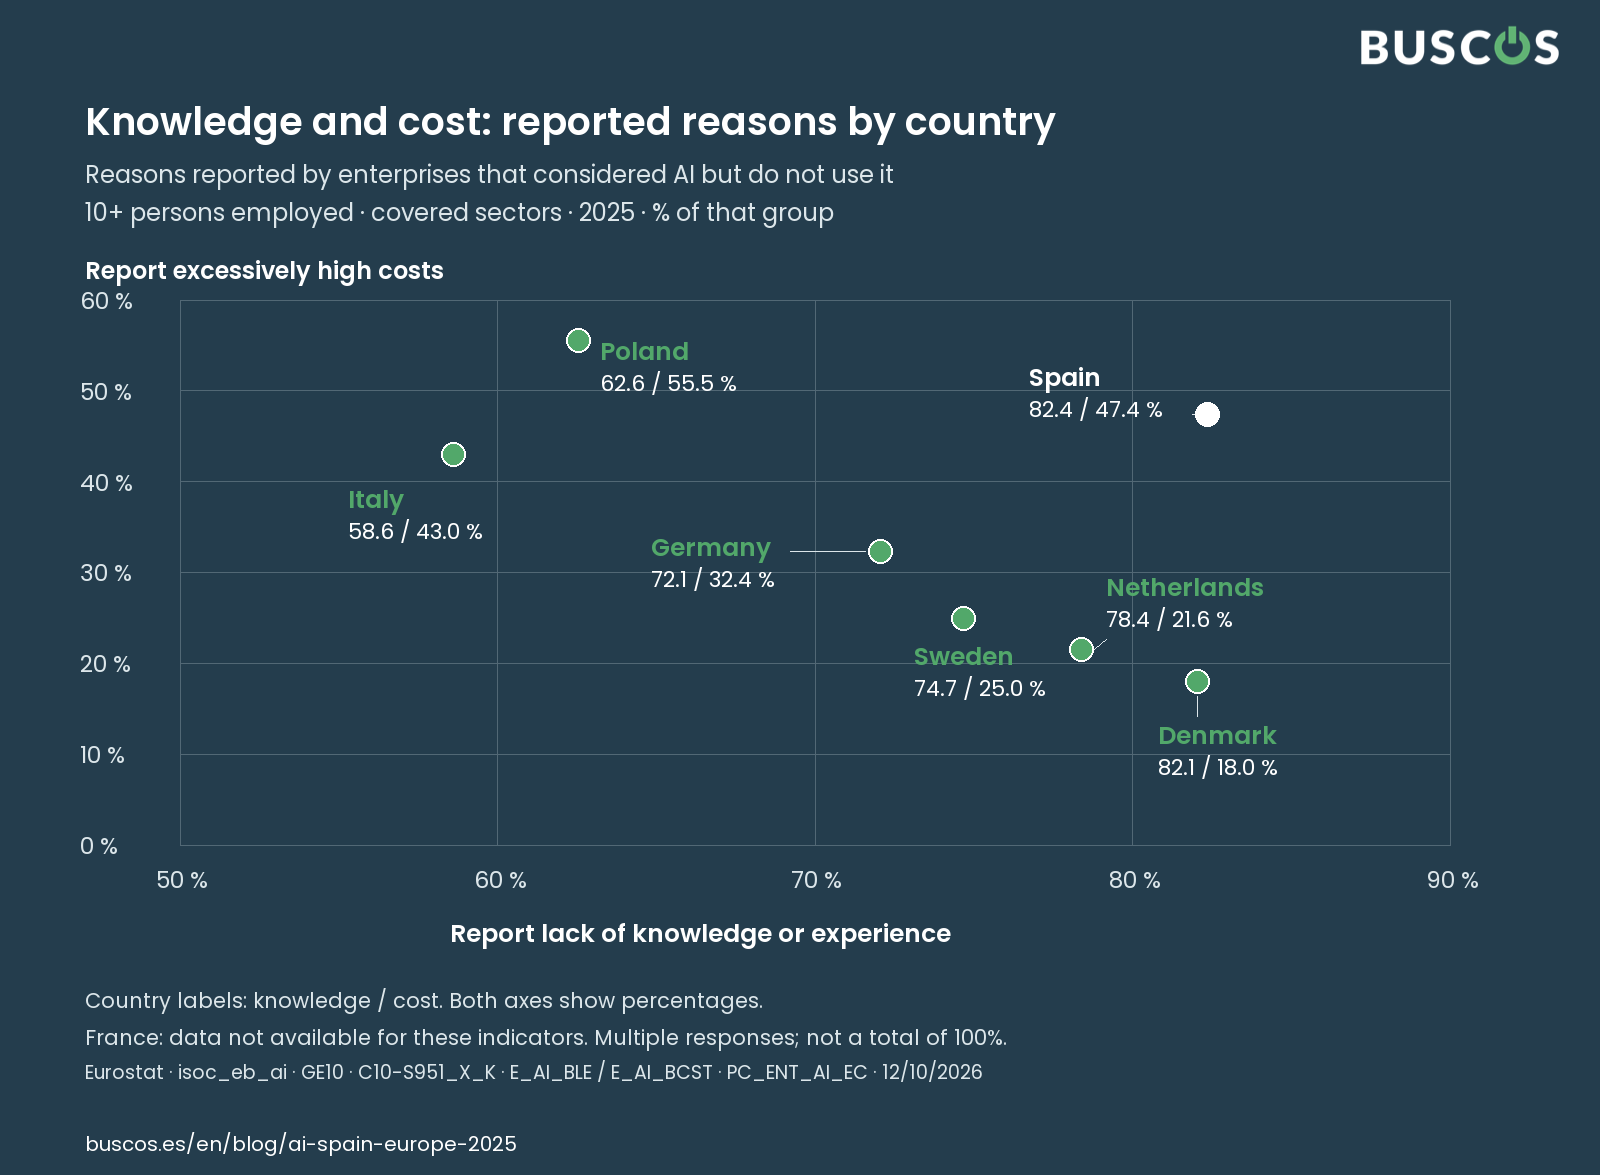
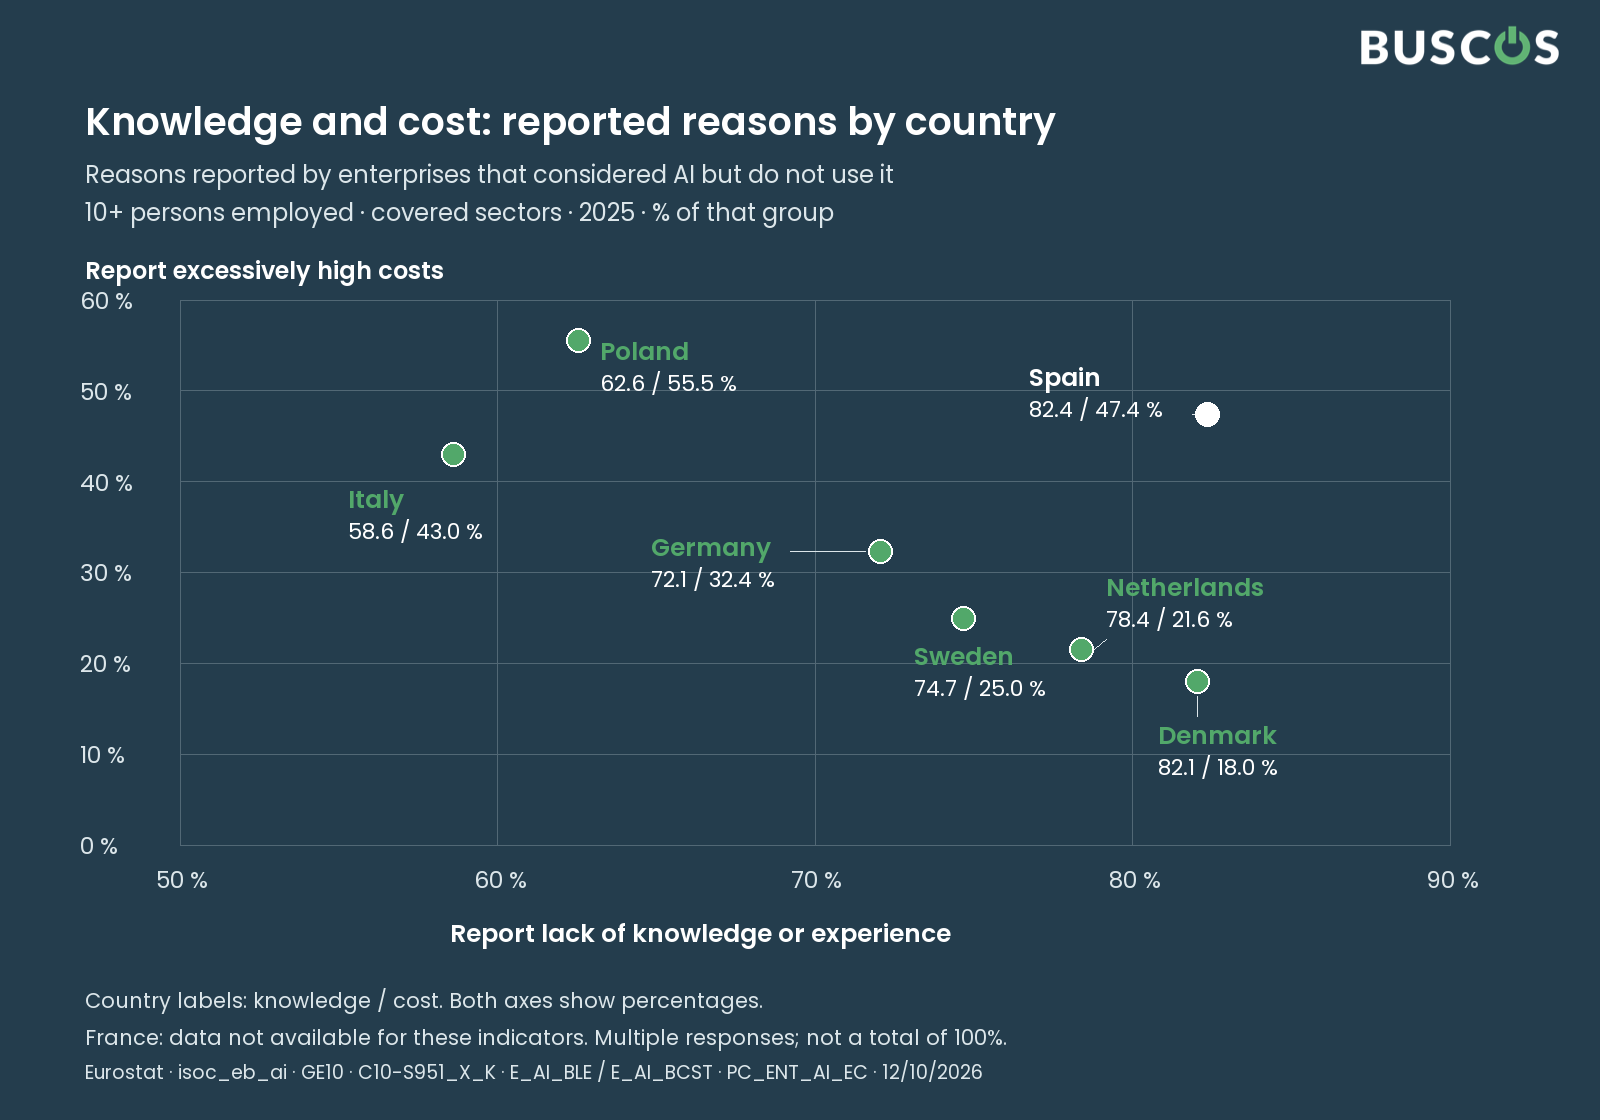
Within that group, lack of knowledge or experience is reported by 82.4% of Spanish enterprises and 82.1% of Danish enterprises. The figures are very close. Among businesses that considered AI but do not use it, the most frequently reported difficulty is almost identical in two countries with very different adoption rates.
Cost shows a larger contrast. It is reported by 47.4% of the Spanish group, compared with 18.0% of the Danish group: almost thirty percentage points apart. Sweden records 25.0% and the Netherlands 21.6%. Cost concerns are reported more frequently in Spain than in these three comparators, within the groups compared.
Lack of knowledge is the most frequently reported reason in all seven selected countries with data, after checking the survey's eight reasons. Cost stands out because of the difference between Spain and Denmark, but it is not Spain's leading reason: privacy (53.8%) and legal consequences (51.3%) are reported more often, while data availability or quality is reported at almost the same rate (48.1%).
Spain also differs from the EU benchmark within this group: knowledge, 82.4% versus 70.3%; cost, 47.4% versus 38.4%. Being close to the EU aggregate in adoption does not mean sharing the same reported reasons for not using AI.
Poland and Germany add further differences
Poland reports excessively high costs for 55.5% of this group of enterprises, above Spain. Lack of knowledge is reported by 62.6%, below Spain's figure. Italy also reports lack of knowledge less frequently than Spain (58.6%), and cost slightly less frequently (43.0%). The combination of difficulties varies.
Germany adds another distinction. Of the enterprises in that group, 62.2% report uncertainty about legal consequences and 60.0% report concerns about data protection and privacy. In Spain, the same responses reach 51.3% and 53.8%, respectively. These reported reasons should be distinguished from difficulties involving knowledge or cost.
The groups also differ in relative size. Among businesses that do not use AI, the proportion that considered using it is 28.0% in Denmark, 14.0% in Spain and 4.3% in Poland. A high percentage for a barrier within that group therefore does not mean a high percentage of all businesses in the country.
France appears in the adoption chart, but has no available values for these barrier indicators in the query used. Missing values are neither filled in nor treated as zero. In this selection, Denmark, Sweden and the Netherlands combine higher adoption with fewer reports of cost concerns than Spain. These aggregate data from different groups do not prove that one explains the other or that the relationship holds business by business.
| Territory | Knowledge | Cost | Legal consequences | Data protection | Data availability or quality |
|---|---|---|---|---|---|
| Spain | 82.4% | 47.4% | 51.3% | 53.8% | 48.1% |
| Denmark | 82.1% | 18.0% | 47.7% | 45.5% | 38.9% |
| Sweden | 74.7% | 25.0% | 39.2% | 49.1% | 44.3% |
| Netherlands | 78.4% | 21.6% | 37.9% | 47.3% | 36.1% |
| Germany | 72.1% | 32.4% | 62.2% | 60.0% | 43.7% |
| France | N/A | N/A | N/A | N/A | N/A |
| Italy | 58.6% | 43.0% | 47.3% | 43.2% | 45.2% |
| Poland | 62.6% | 55.5% | 52.3% | 49.4% | 33.4% |
| EU-27 | 70.3% | 38.4% | 53.6% | 52.7% | 43.5% |
Percentage of the group that considered AI but does not use it, not of all enterprises. Five of the eight reasons collected by Eurostat. Multiple responses: they do not add up to 100%. N/A: data not available, not zero. EU: European aggregate.
The questions this comparison raises
These responses raise three practical questions. They are our reading of the analysis, not direct quotations attributed to every business owner in a country.
If the difficulty is lack of knowledge: what does the team need to learn to tackle that work? The answer is more useful when it describes a task the team must be able to carry out, rather than simply asking for AI training. We explore this issue separately in our article on the knowledge gap in Spain.
If the difficulty is cost: what are we budgeting for, and what change would justify that expense? It makes sense to review what a proposal includes, what maintaining it requires and how the result would be checked. Eurostat's figure identifies a concern; that review helps explain a particular business's situation.
If the concern involves data or legal consequences: what information would be used, with what permissions and under what conditions? Clarifying these questions helps define the work before putting a solution into use.
From the EU benchmark to your situation
The contrast between Spain and Denmark makes one point clear: more widespread adoption can coexist with very similar knowledge difficulties among businesses that have not yet taken the step. At the same time, reasons involving cost, data or legal conditions differ between countries.
For a Spanish business, the analysis becomes useful when it recognises a difficulty of its own. It may have a task that needs improvement and a team that does not yet know how to tackle it. Or an AI proposal whose cost is understood, but whose scope remains unclear.
BUSCOS free diagnoses start with that situation: what is happening, what your business needs and what help would make sense. Tell us about a specific problem or situation. We review each request and, if it fits BUSCOS, send access so you can explain your case in detail.
Sources and how to read the data
Eurostat, isoc_eb_ai. Reference year 2025, ten or more persons employed, NACE filter C10-S951_X_K. The survey covers manufacturing, utilities, construction, trade, transport, accommodation, information, real estate, professional and administrative activities, and repair of computers and communication equipment. Agriculture, mining, finance, public administration, education and health are among the excluded activities. Adoption uses E_AI_TANY/PC_ENT; barriers use PC_ENT_AI_EC. Consideration among non-users uses E_AI_EC/PC_ENT_AI_TX. Netherlands: break in the adoption series in 2025. France: data not available for the barrier indicators queried. Dataset updated 15 June 2026; consulted 12 October 2026. The EU is an aggregate, not the arithmetic average of this selection. Reported reasons do not establish the causes of differences between countries or implementation outcomes.