
One survey, different starting points
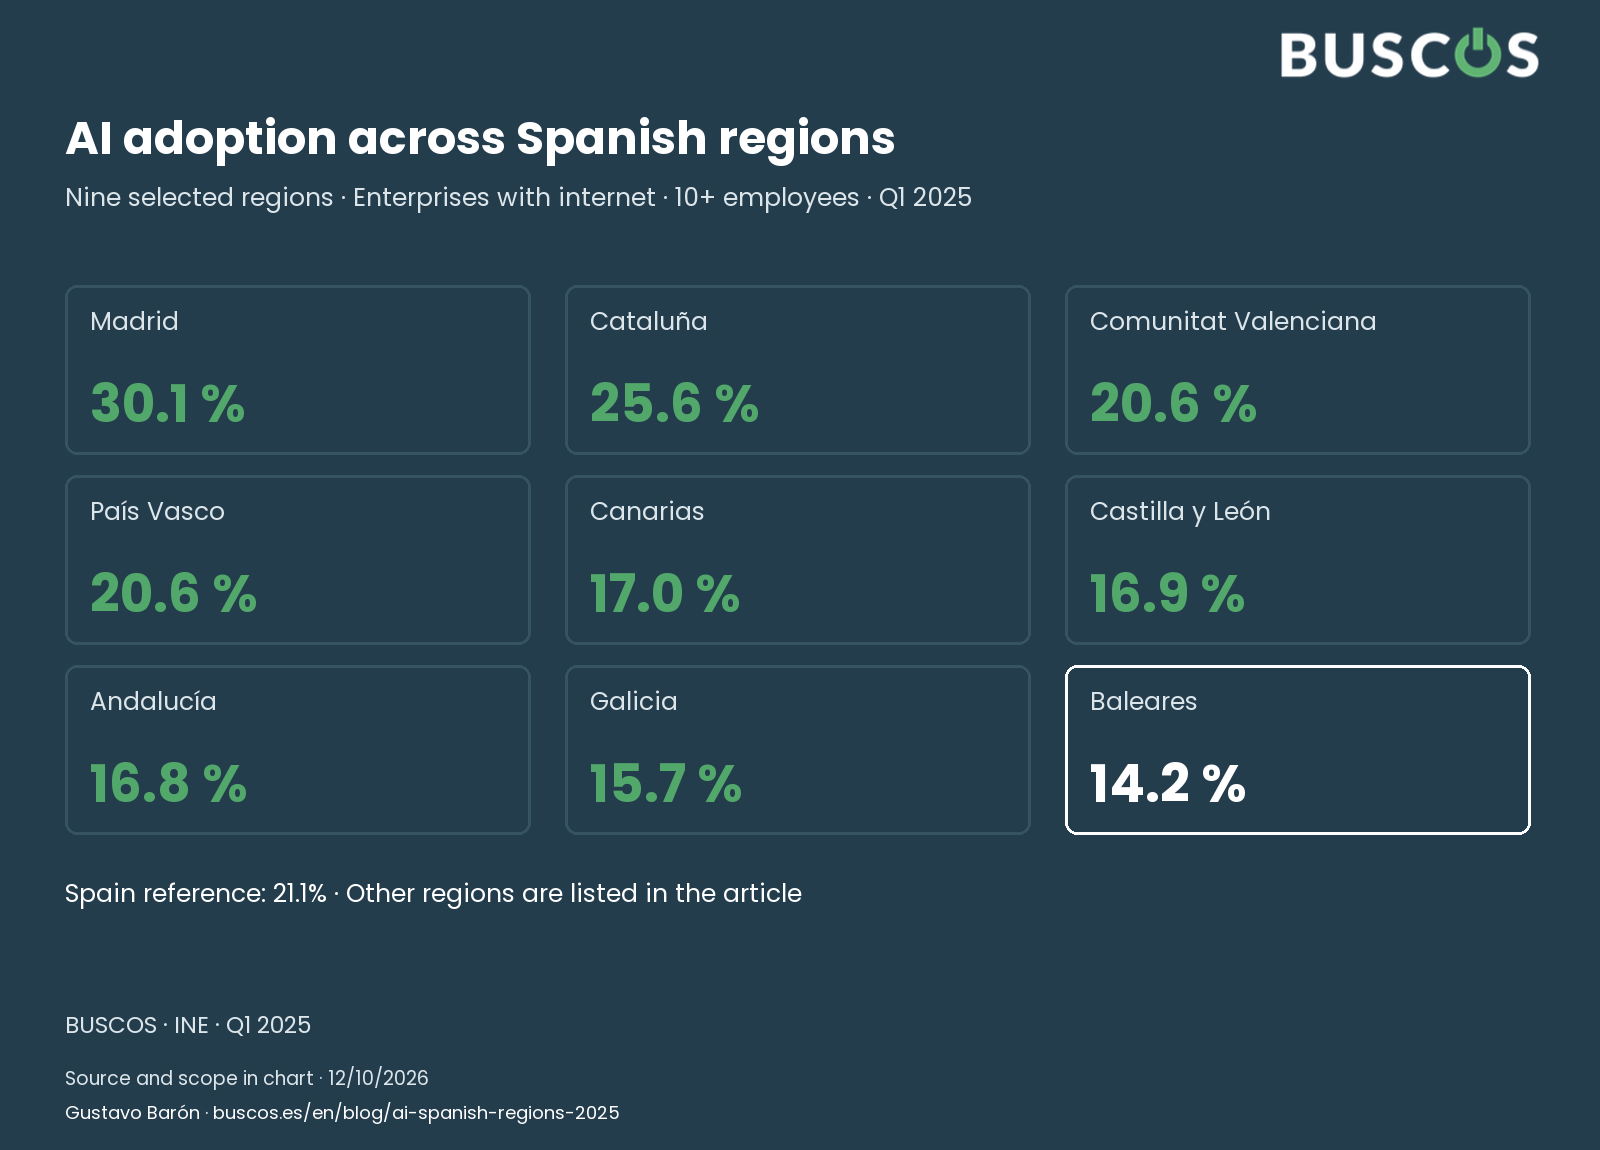
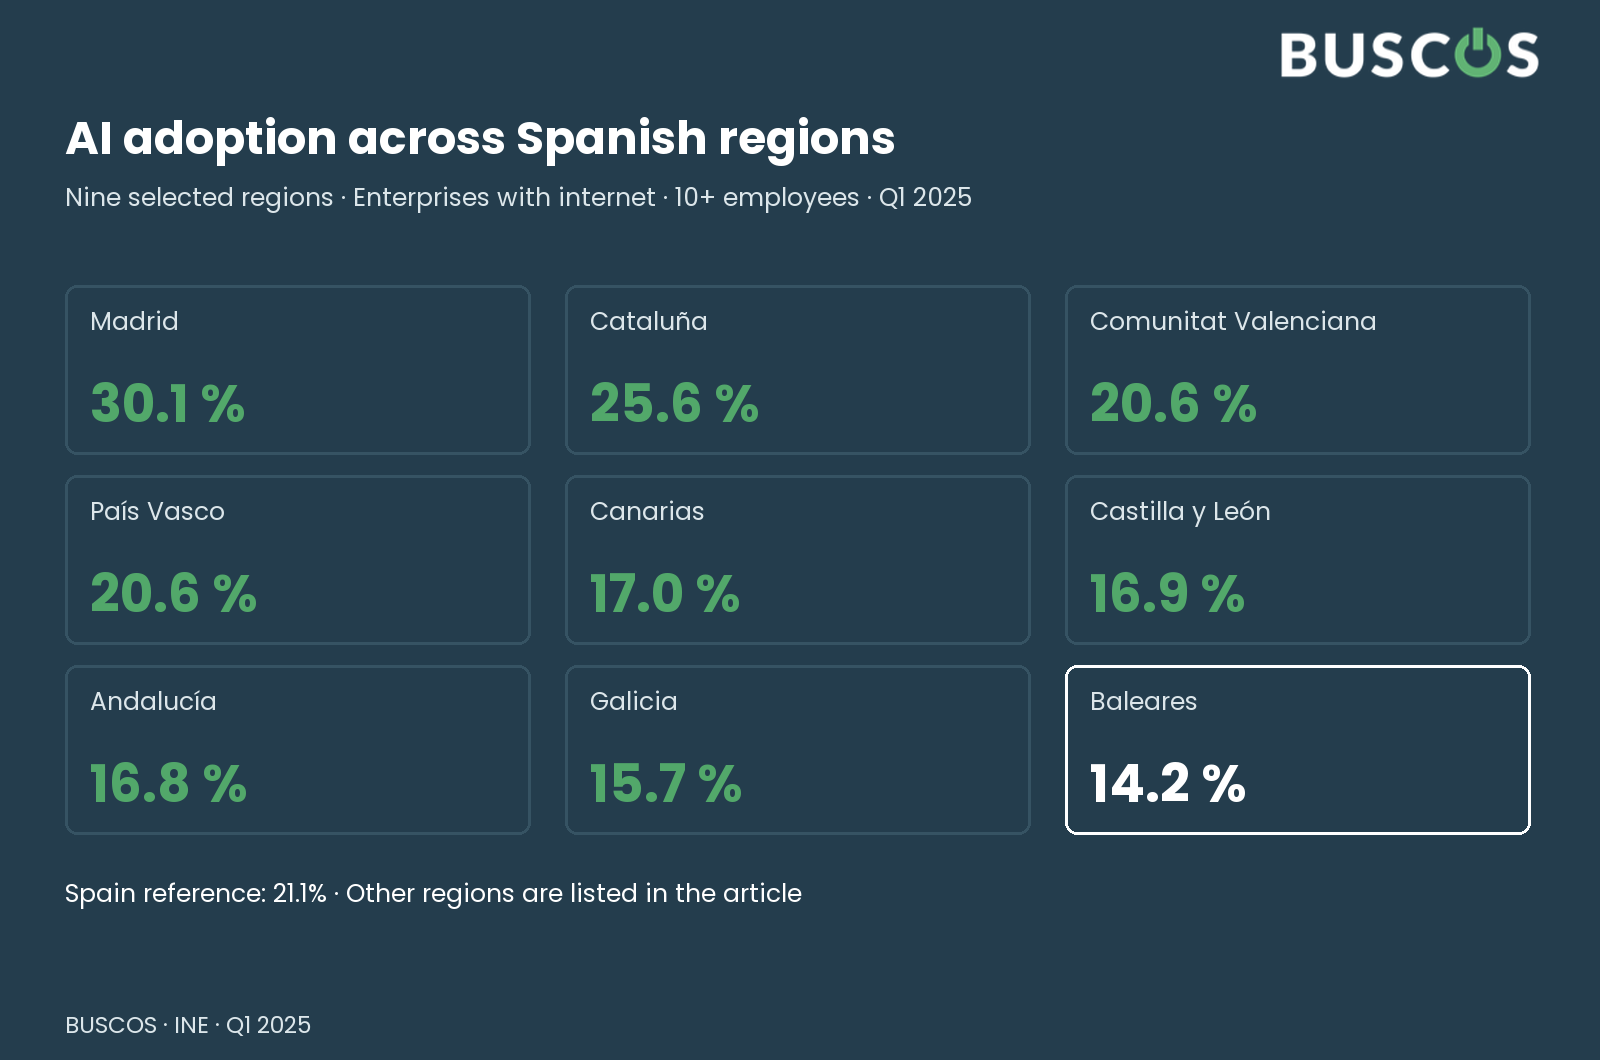
Madrid records 30.1% of enterprises using AI and Catalonia 25.6%. The Balearics stand at 14.2%. Madrid and the Balearics are 15.9 percentage points apart: a visible difference within the same INE table. The national benchmark is 21.1%, and not every region is close to it.
The figures refer to the first quarter of 2025 and enterprises with ten or more employees, an Internet connection and activity within the covered sectors. Location follows the registered headquarters. We are not counting every business in a region or measuring every establishment where it operates.
This framework allows comparisons within the table. It also limits the conclusion: using a technology does not mean using it in the same way, for the same volume of work or with the same results. The chart describes the spread of use, not the quality of implementations.
The national benchmark is not a simple average of the regions
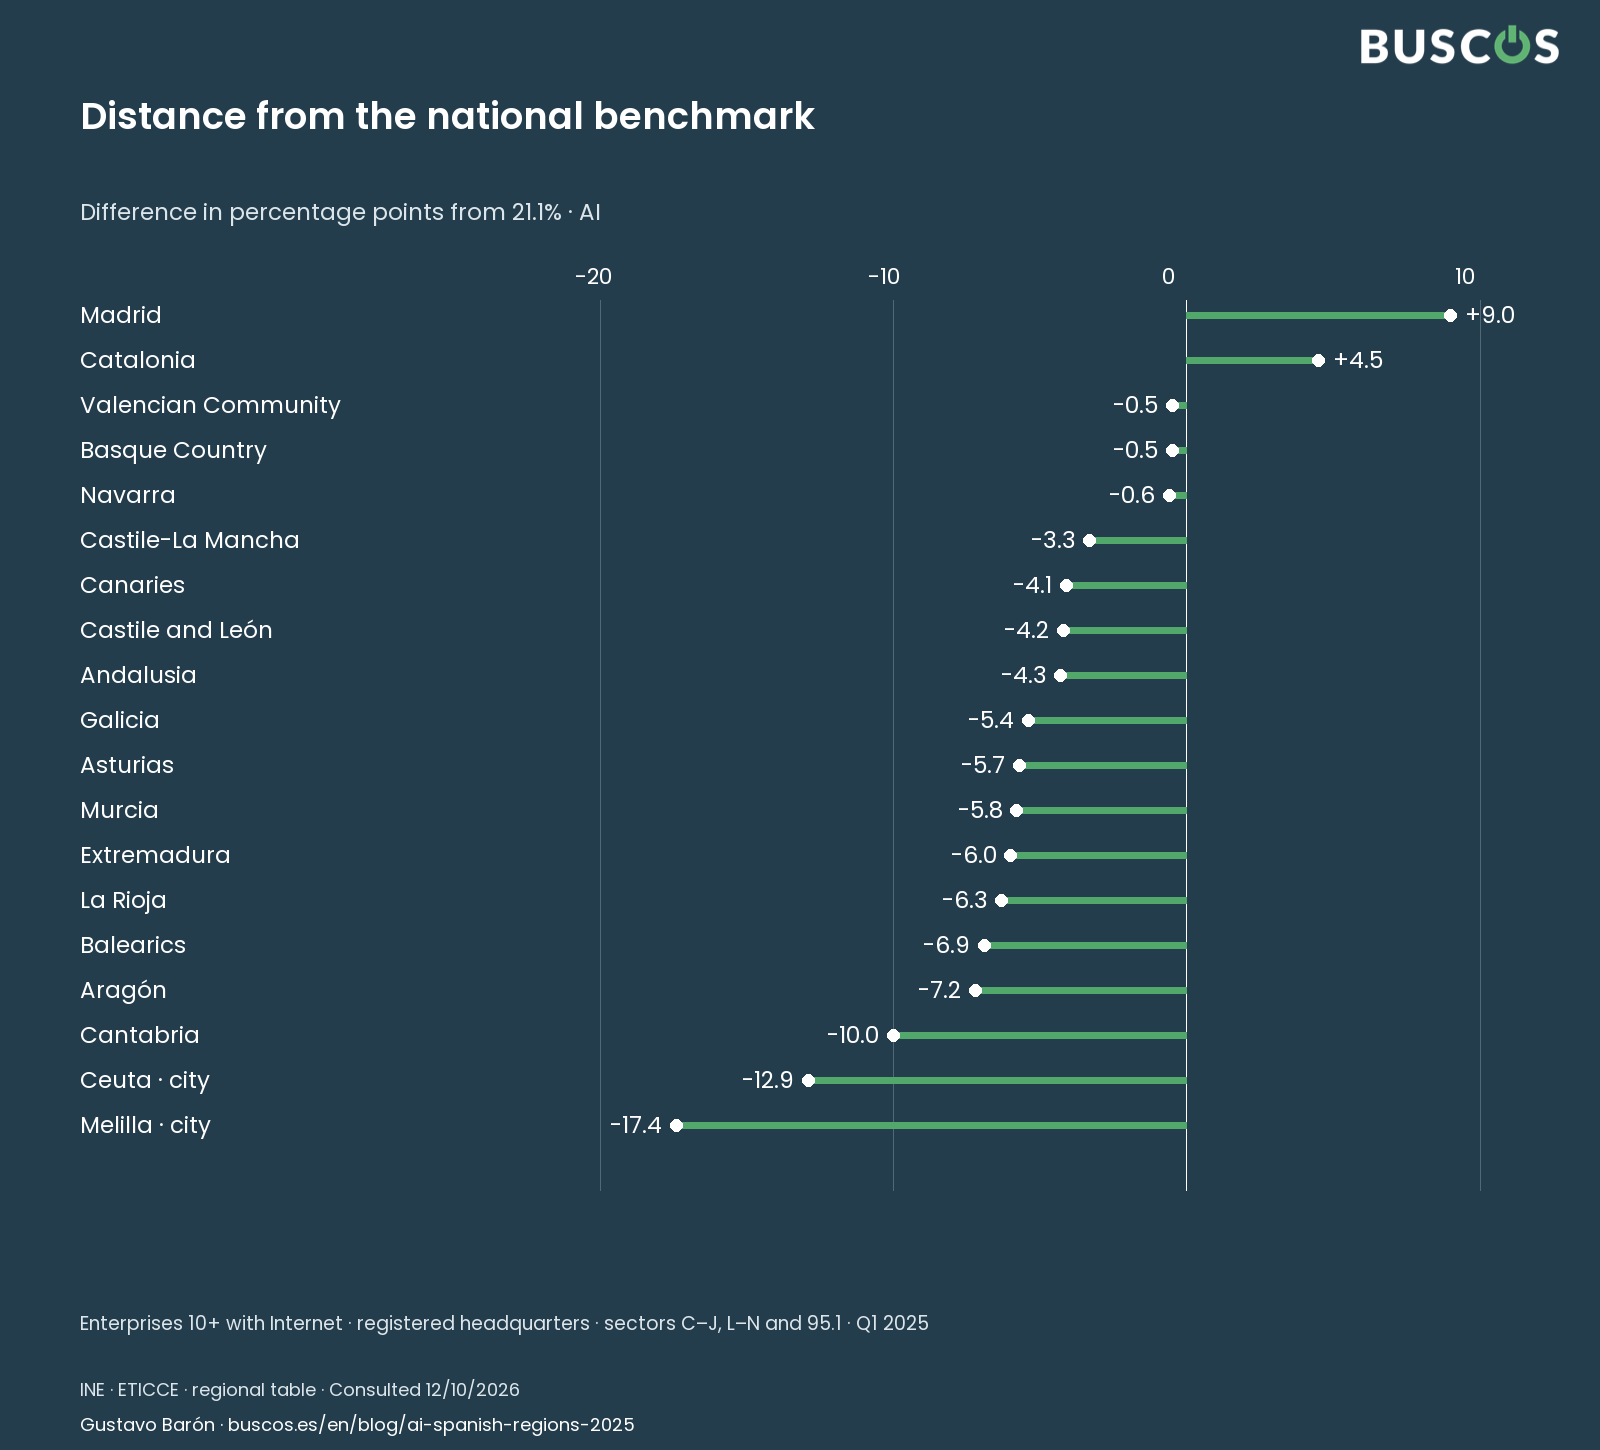
The original chart selects regions in different positions. Madrid and Catalonia exceed the national benchmark. The Valencian Community and the Basque Country record 20.6%, close to it but below; the Balearics are 6.9 points below. The open table includes every territory so that the visual selection does not hide the remaining figures.
Regions do not have the same number or composition of businesses. We do not average their percentages to reconstruct Spain. The national figure is the benchmark published by INE, not another region. Nor do we combine regions into an 'other' category: each retains its own value.
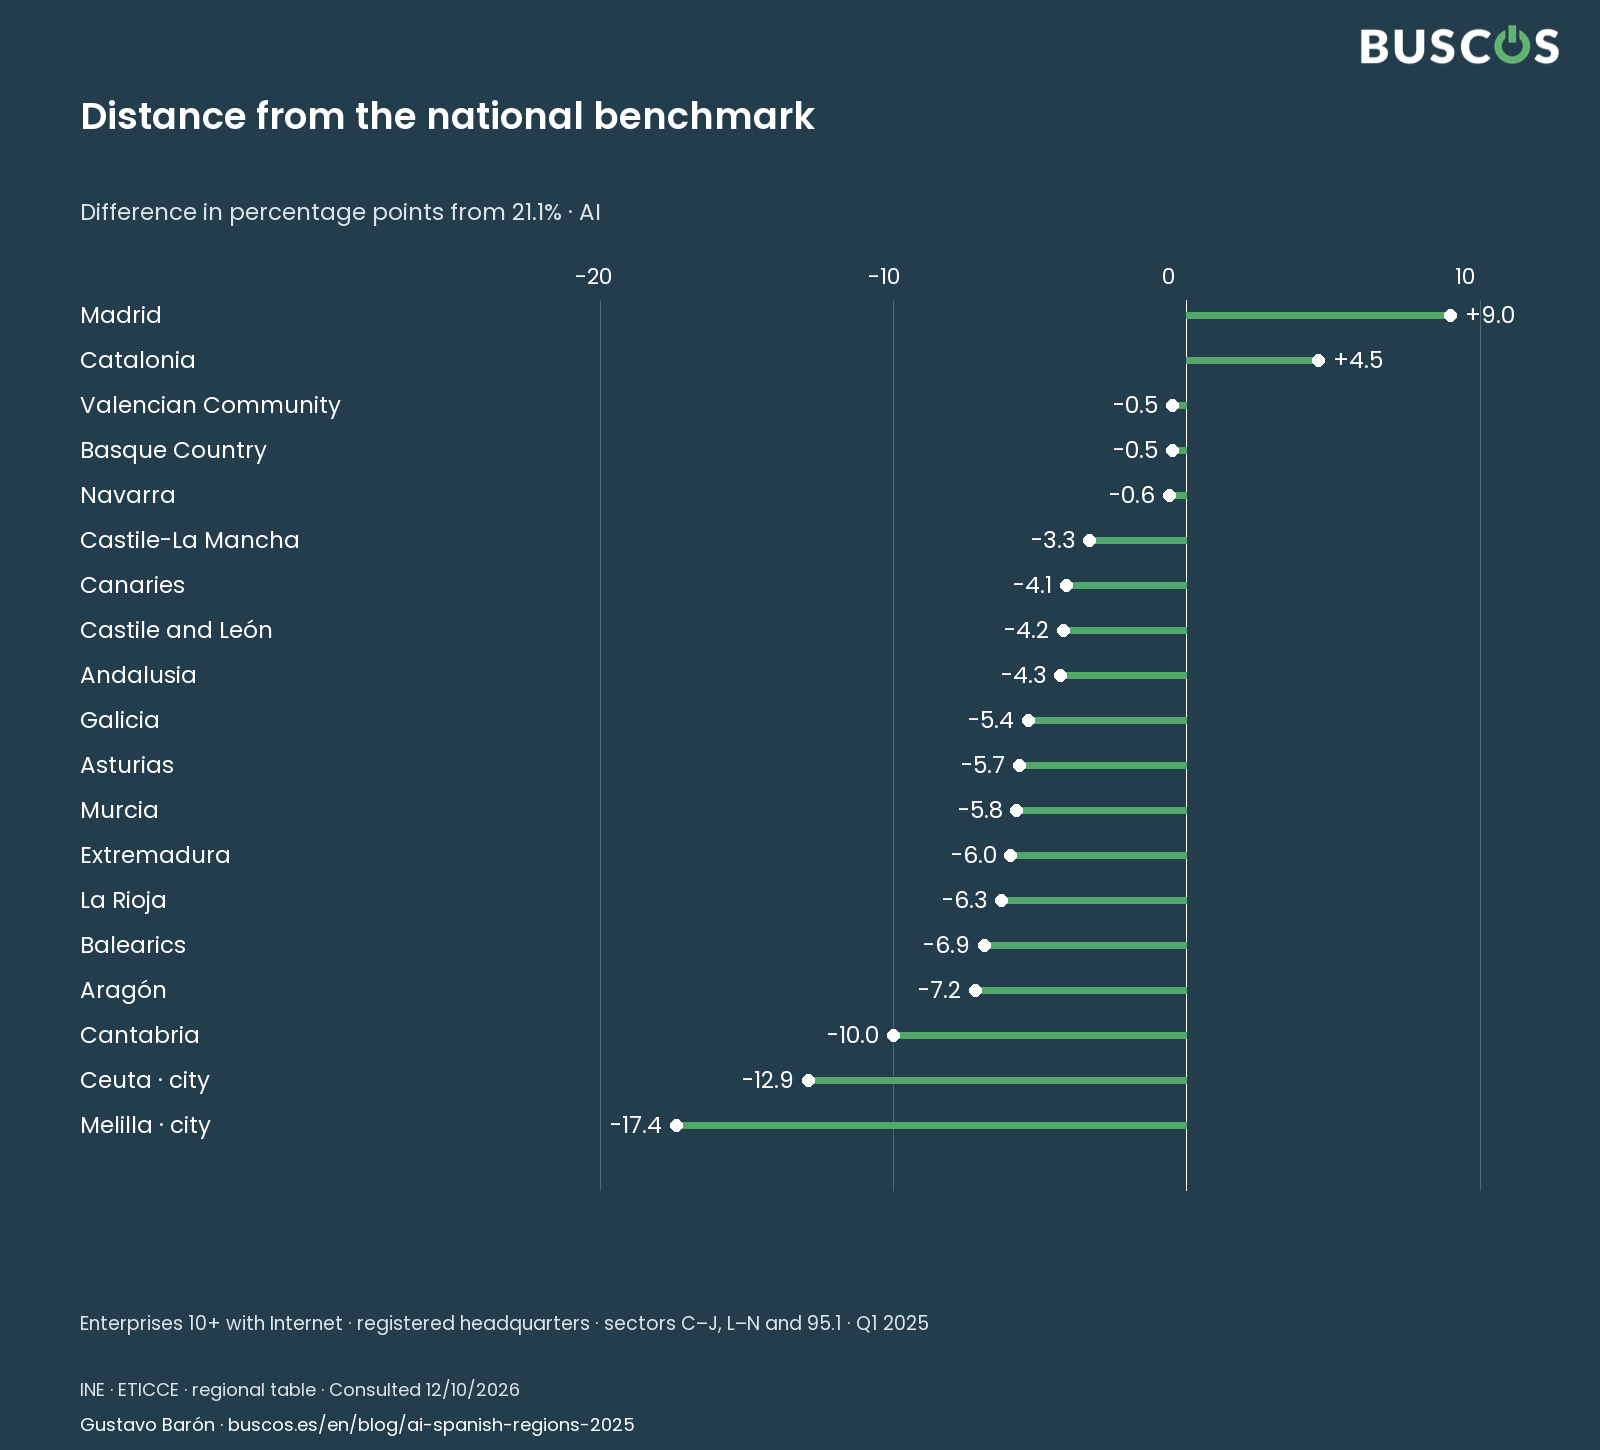
The distance chart makes one question easier to answer: how many points separate each territory from the benchmark? Positive and negative figures subtract percentages within the same table. They are not percentages of delay, estimates of years needed to catch up or measures of competitiveness.
| Territory | AI | Paid cloud | In-house analytics |
|---|---|---|---|
| Spain | 21.1 % | 44.3 % | 41.4 % |
| Andalusia | 16.8 % | 35.9 % | 38.1 % |
| Aragón | 13.9 % | 37.3 % | 40.1 % |
| Asturias | 15.4 % | 31.9 % | 29.6 % |
| Balearics | 14.2 % | 39.1 % | 32.5 % |
| Canaries | 17.0 % | 36.4 % | 35.9 % |
| Cantabria | 11.1 % | 31.8 % | 33.9 % |
| Castile and León | 16.9 % | 33.7 % | 37.8 % |
| Castile-La Mancha | 17.8 % | 31.2 % | 33.6 % |
| Catalonia | 25.6 % | 58.0 % | 44.8 % |
| Valencian Community | 20.6 % | 40.7 % | 44.5 % |
| Extremadura | 15.1 % | 29.3 % | 28.8 % |
| Galicia | 15.7 % | 38.2 % | 33.9 % |
| Madrid | 30.1 % | 54.2 % | 48.7 % |
| Murcia | 15.3 % | 37.0 % | 37.0 % |
| Navarra | 20.5 % | 40.4 % | 41.2 % |
| Basque Country | 20.6 % | 44.0 % | 45.0 % |
| La Rioja | 14.8 % | 34.8 % | 39.6 % |
| Ceuta · autonomous city | 8.2 % | 31.3 % | 23.0 % |
| Melilla · autonomous city | 3.7 % | 6.4 % | 16.7 % |
Enterprises 10+ with Internet, by registered headquarters. Spain is the national benchmark, not a region.
Ceuta and Melilla matter, but they are autonomous cities
The source publishes figures for seventeen autonomous communities and two autonomous cities. Ceuta records 8.2% and Melilla 3.7%. Keeping their figures in the table matters; calling them autonomous communities or erasing their institutional distinction would be inaccurate.
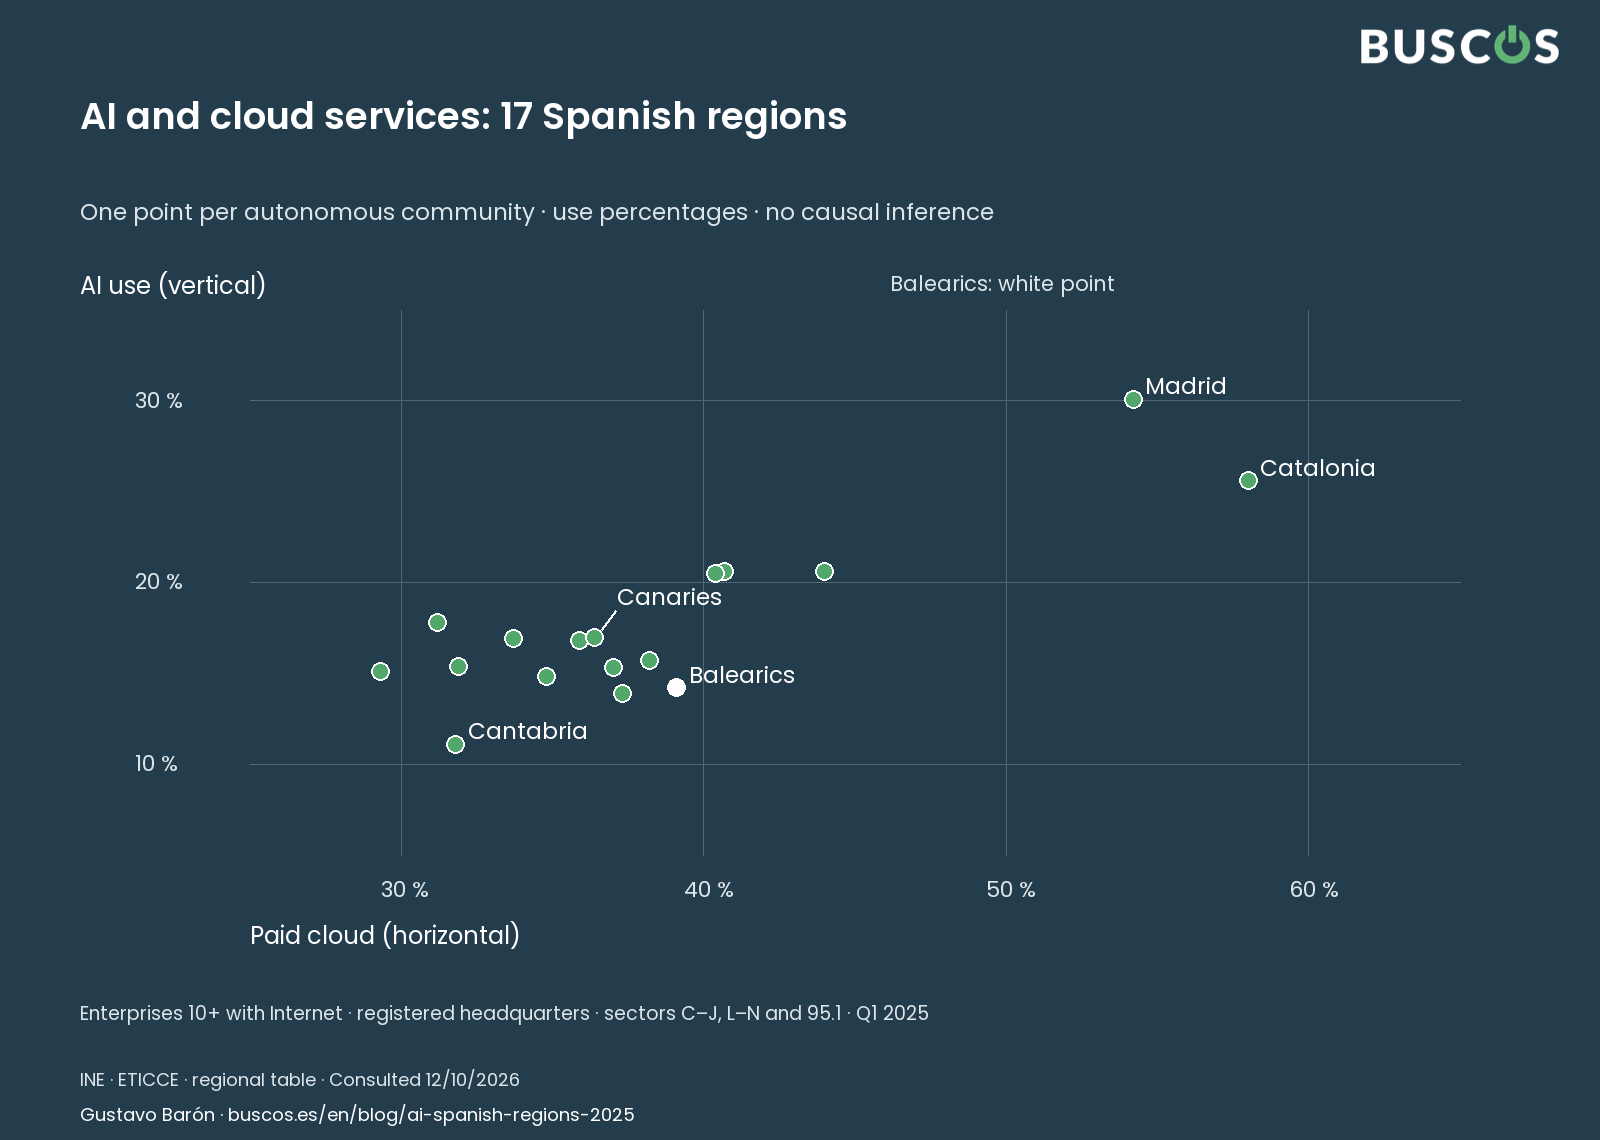
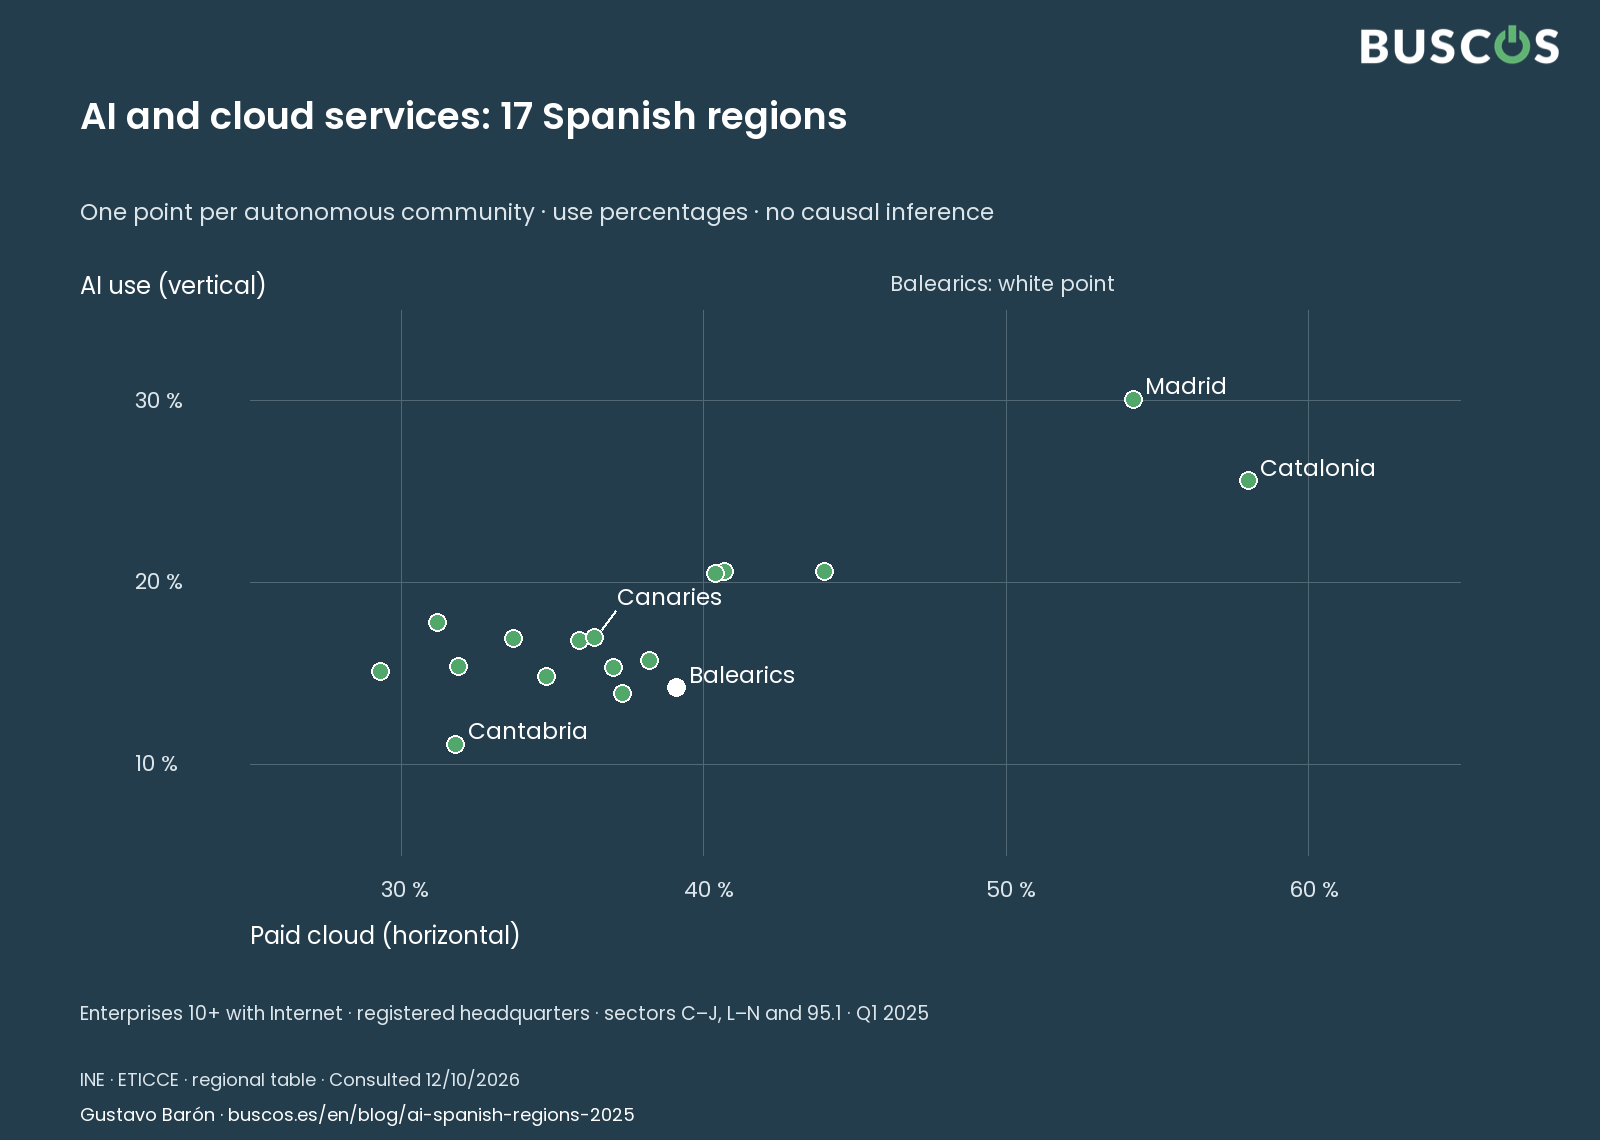
The distance chart identifies them as autonomous cities. The comparison between AI and cloud-service use includes only the seventeen autonomous communities, excluding the national aggregate too. Every point therefore represents the same type of territorial unit.
These figures do not need to become a map to be rigorous. A dot chart makes positions and labels readable, while a table gives exact values. The chart form serves the comparison rather than creating an appearance of precision the data cannot support.
Cloud services and analytics add context, not an automatic explanation
The same table includes paid cloud computing and data analytics. These are different indicators from AI use, within the same regional scope of Internet-connected businesses. Reading them together describes digital context without turning every technology into one measure.
The chart places each region using two percentages: paid cloud-service use and AI use. The table adds analytics performed by the business's own employees. A region may have a substantial proportion of cloud users and a smaller proportion reporting AI. The categories are not exclusive: one business may use several technologies.
The distribution of points does not show that buying cloud services causes AI adoption. It does not identify which individual businesses use both technologies either. Studying that relationship would require other data. Here the comparison raises questions about information, processes and needs that an adoption rate alone cannot answer.
| Territory | AI use | Difference in percentage points |
|---|---|---|
| Madrid | 30.1 % | 9.0 points |
| Catalonia | 25.6 % | 4.5 points |
| Valencian Community | 20.6 % | -0.5 points |
| Basque Country | 20.6 % | -0.5 points |
| Navarra | 20.5 % | -0.6 points |
| Castile-La Mancha | 17.8 % | -3.3 points |
| Canaries | 17.0 % | -4.1 points |
| Castile and León | 16.9 % | -4.2 points |
| Andalusia | 16.8 % | -4.3 points |
| Galicia | 15.7 % | -5.4 points |
| Asturias | 15.4 % | -5.7 points |
| Murcia | 15.3 % | -5.8 points |
| Extremadura | 15.1 % | -6.0 points |
| La Rioja | 14.8 % | -6.3 points |
| Balearics | 14.2 % | -6.9 points |
| Aragón | 13.9 % | -7.2 points |
| Cantabria | 11.1 % | -10.0 points |
| Ceuta | 8.2 % | -12.9 points |
| Melilla | 3.7 % | -17.4 points |
Difference from the national 21.1%. It does not measure productivity or percentage delay.
Registered headquarters do not describe every workplace
A business may have its registered headquarters in one region and operate in several. The statistic follows headquarters, so it cannot locate every use of AI in a shop, hotel or operating centre. That distinction matters when discussing regions with companies running multiple sites.
There are no provincial rates or separate island figures here. The Balearic percentage is not a percentage for Mallorca. Renaming the geography to make a figure feel closer to the reader would change what is being measured rather than improve the explanation.
Territorial context can start a conversation, but needs are examined in actual work. Two businesses in the same region can face very different difficulties: scattered information, repeated tasks, responses needing review or a proposal with an unclear scope. No regional average selects a solution for an individual company.
What to ask when a provider uses a regional figure
A regional chart can provide context for a commercial proposal. Check that its presenter retains the year, population and source. Then ask a more important question: how does the figure relate to the work being offered? An average adoption rate does not establish that a solution is appropriate for the business.
Ask for an explanation using information the company recognises, the people involved and the exceptions expected. If the business has several sites, what changes between them and what information must remain consistent? That detail helps assess the proposal against a real problem without attributing causes to a region.
The decision improves when the conversation moves from how many businesses use AI to what can be checked in this assignment. A provider may understand a tool well while needing different experience to integrate it into a specific process. The required specialism follows the work, not the territory's position in a chart.
From a regional figure to a decision you can check
Imagine a business with several sites receiving requests through different channels. The useful question is not whether it uses as much AI as another region. It is what information gets repeated, where errors appear, who understands exceptions and what change could improve the work. This illustrates how to define a need; it is not a client result.
From there, the business can examine whether its team needs learning, whether a proposal needs review or whether a specialist professional or provider is needed. Before commissioning implementation, the scope should explain what is included, what remains unresolved and how performance will be checked against actual working situations.
Regional differences are a useful starting point for looking. A business decision needs another step: describing one situation, its information and the people who understand it. That work avoids buying through comparison and makes it possible to seek help with what actually needs resolving.
Sources and how to read the data
Primary sources consulted on 12 October 2026. Practical examples are BUSCOS interpretations, not client results.